Chaos Monkey for Spring Boot Microservices

How many of you have never encountered a crash or a failure of your systems in production environment? Certainly, each one of you, sooner or later, has experienced it. If we are not able to avoid a failure, the solution seems to be maintaining our system in the state of permanent failure. This concept underpins the tool invented by Netflix to test the resilience of its IT infrastructure – Chaos Monkey. A few days ago I came across the solution, based on the idea behind Netflix’s tool, designed to test Spring Boot applications. Such a library has been implemented by Codecentric. Until now, I recognize them only as the authors of other interesting solution dedicated for Spring Boot ecosystem – Spring Boot Admin. I have already described this library in one of my previous articles Monitoring Microservices With Spring Boot Admin (https://piotrminkowski.wordpress.com/2017/06/26/monitoring-microservices-with-spring-boot-admin).
Today I’m going to show you how to include Codecentric’s Chaos Monkey in your Spring Boot application, and then implement chaos engineering in sample system consists of some microservices. The Chaos Monkey library can be used together with Spring Boot 2.0, and the current release version of it is 1.0.1. However, I’ll implement the sample using version 2.0.0-SNAPSHOT, because it has some new interesting features not available in earlier versions of this library. In order to be able to download SNAPSHOT version of Codecentric’s Chaos Monkey library you have to remember about including Maven repository https://oss.sonatype.org/content/repositories/snapshots to your repositories in pom.xml.

1. Enable Chaos Monkey for an application

There are two required steps for enabling Chaos Monkey for Spring Boot application. First, let’s add library chaos-monkey-spring-boot to the project’s dependencies.

<dependency>
	<groupId>de.codecentric</groupId>
	<artifactId>chaos-monkey-spring-boot</artifactId>
	<version>2.0.0-SNAPSHOT</version>
</dependency>

Then, we should activate profile chaos-monkey on application startup.

$ java -jar target/order-service-1.0-SNAPSHOT.jar --spring.profiles.active=chaos-monkey

2. Sample system architecture

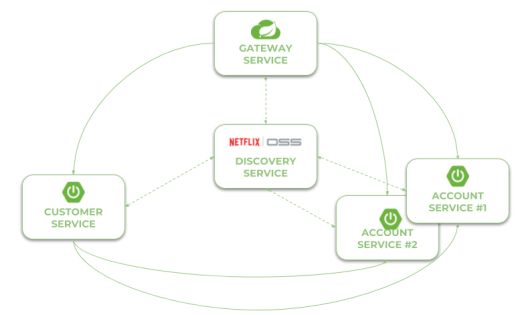
Our sample system consists of three microservices, each started in two instances, and a service discovery server. Microservices registers themselves against a discovery server, and communicates with each other through HTTP API. Chaos Monkey library is included to every single instance of all running microservices, but not to the discovery server. Here’s the diagram that illustrates the architecture of our sample system.

chaos

The source code of sample applications is available on GitHub in repository sample-spring-chaosmonkey (https://github.com/piomin/sample-spring-chaosmonkey.git). After cloning this repository and building it using mnv clean install command, you should first run discovery-service. Then run two instances of every microservice on different ports by setting -Dserver.port property with an appropriate number. Here’s a set of my running commands.

$ java -jar target/discovery-service-1.0-SNAPSHOT.jar
$ java -jar target/order-service-1.0-SNAPSHOT.jar --spring.profiles.active=chaos-monkey
$ java -jar -Dserver.port=9091 target/order-service-1.0-SNAPSHOT.jar --spring.profiles.active=chaos-monkey
$ java -jar target/product-service-1.0-SNAPSHOT.jar --spring.profiles.active=chaos-monkey
$ java -jar -Dserver.port=9092 target/product-service-1.0-SNAPSHOT.jar --spring.profiles.active=chaos-monkey
$ java -jar target/customer-service-1.0-SNAPSHOT.jar --spring.profiles.active=chaos-monkey
$ java -jar -Dserver.port=9093 target/customer-service-1.0-SNAPSHOT.jar --spring.profiles.active=chaos-monkey

3. Process configuration

In version 2.0.0-SNAPSHOT of chaos-monkey-spring-boot library Chaos Monkey is by default enabled for applications that include it. You may disable it using property chaos.monkey.enabled. However, the only assault which is enabled by default is latency. This type of assault adds a random delay to the requests processed by the application in the range determined by properties chaos.monkey.assaults.latencyRangeStart and chaos.monkey.assaults.latencyRangeEnd. The number of attacked requests is dependent of property chaos.monkey.assaults.level, where 1 means each request and 10 means each 10th request. We can also enable exception and appKiller assault for our application. For simplicity, I set the configuration for all the microservices. Let’s take a look on settings provided in application.yml file.

chaos:
  monkey:
    assaults:
	  level: 8
	  latencyRangeStart: 1000
	  latencyRangeEnd: 10000
	  exceptionsActive: true
	  killApplicationActive: true
	watcher:
	  repository: true
      restController: true

In theory, the configuration visible above should enable all three available types of assaults. However, if you enable latency and exceptions, killApplication will never happen. Also, if you enable both latency and exceptions, all the requests send to application will be attacked, no matter which level is set with chaos.monkey.assaults.level property. It is important to remember about activating restController watcher, which is disabled by default.

4. Enable Spring Boot Actuator endpoints

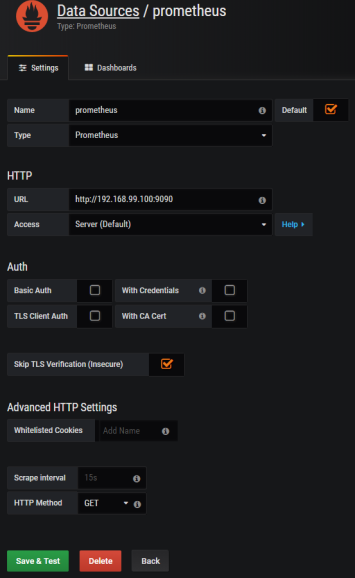
Codecentric implements a new feature in the version 2.0 of their Chaos Monkey library – the endpoint for Spring Boot Actuator. To enable it for our applications we have to activate it following actuator convention – by setting property management.endpoint.chaosmonkey.enabled to true. Additionally, beginning from version 2.0 of Spring Boot we have to expose that HTTP endpoint to be available after application startup.

management:
  endpoint:
    chaosmonkey:
      enabled: true
  endpoints:
    web:
      exposure:
        include: health,info,chaosmonkey

The chaos-monkey-spring-boot provides several endpoints allowing you to check out and modify configuration. You can use method GET /chaosmonkey to fetch the whole configuration of library. Yo may also disable chaos monkey after starting application by calling method POST /chaosmonkey/disable. The full list of available endpoints is listed here: https://codecentric.github.io/chaos-monkey-spring-boot/2.0.0-SNAPSHOT/#endpoints.

5. Running applications

All the sample microservices stores data in MySQL. So, the first step is to run MySQL database locally using its Docker image. The Docker command visible below also creates database and user with password.

$ docker run -d --name mysql -e MYSQL_DATABASE=chaos -e MYSQL_USER=chaos -e MYSQL_PASSWORD=chaos123 -e MYSQL_ROOT_PASSWORD=123456 -p 33306:3306 mysql

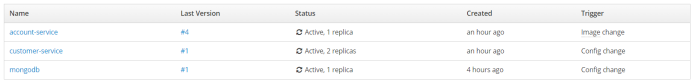
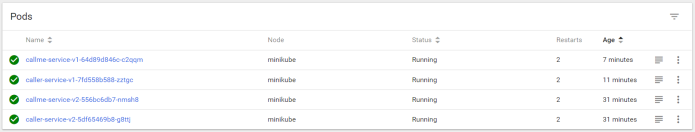
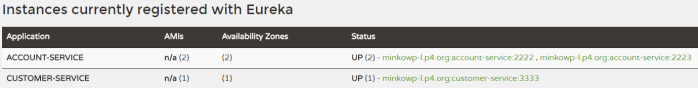
After running all the sample applications, where all microservices are multiplied in two instances listening on different ports, our environment looks like in the figure below.

chaos-4

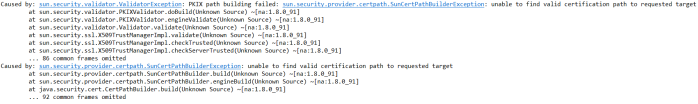
You will see the following information in your logs during application boot.

chaos-5

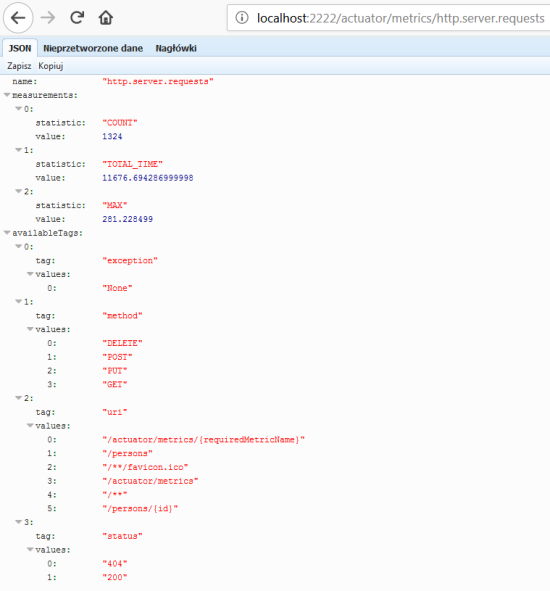
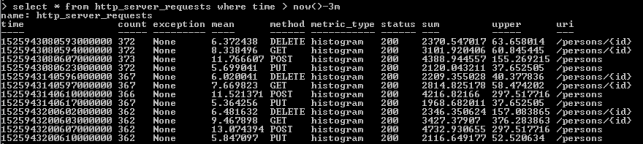
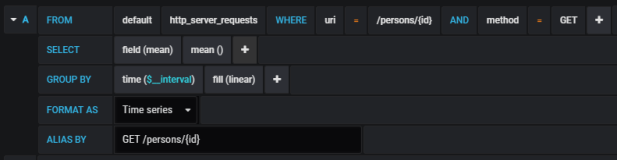
We may check out Chaos Monkey configuration settings for every running instance of application by calling the following actuator endpoint.

chaos-3

6. Testing the system

For the testing purposes, I used popular performance testing library – Gatling. It creates 20 simultaneous threads, which calls POST /orders and GET /order/{id} methods exposed by order-service via API gateway 500 times per each thread.

class ApiGatlingSimulationTest extends Simulation {

  val scn = scenario("AddAndFindOrders").repeat(500, "n") {
        exec(
          http("AddOrder-API")
            .post("http://localhost:8090/order-service/orders")
            .header("Content-Type", "application/json")
            .body(StringBody("""{"productId":""" + Random.nextInt(20) + ""","customerId":""" + Random.nextInt(20) + ""","productsCount":1,"price":1000,"status":"NEW"}"""))
            .check(status.is(200),  jsonPath("$.id").saveAs("orderId"))
        ).pause(Duration.apply(5, TimeUnit.MILLISECONDS))
        .
        exec(
          http("GetOrder-API")
            .get("http://localhost:8090/order-service/orders/${orderId}")
            .check(status.is(200))
        )
  }

  setUp(scn.inject(atOnceUsers(20))).maxDuration(FiniteDuration.apply(10, "minutes"))

}

POST endpoint is implemented inside OrderController in add(...) method. It calls find methods exposed by customer-service and product-service using OpenFeign clients. If customer has a sufficient funds and there are still products in stock, it accepts the order and performs changes for customer and product using PUT methods. Here’s the implementation of two methods tested by Gatling performance test.

@RestController
@RequestMapping("/orders")
public class OrderController {

	@Autowired
	OrderRepository repository;
	@Autowired
	CustomerClient customerClient;
	@Autowired
	ProductClient productClient;

	@PostMapping
	public Order add(@RequestBody Order order) {
		Product product = productClient.findById(order.getProductId());
		Customer customer = customerClient.findById(order.getCustomerId());
		int totalPrice = order.getProductsCount() * product.getPrice();
		if (customer != null && customer.getAvailableFunds() >= totalPrice && product.getCount() >= order.getProductsCount()) {
			order.setPrice(totalPrice);
			order.setStatus(OrderStatus.ACCEPTED);
			product.setCount(product.getCount() - order.getProductsCount());
			productClient.update(product);
			customer.setAvailableFunds(customer.getAvailableFunds() - totalPrice);
			customerClient.update(customer);
		} else {
			order.setStatus(OrderStatus.REJECTED);
		}
		return repository.save(order);
	}

	@GetMapping("/{id}")
	public Order findById(@PathVariable("id") Integer id) {
		Optional order = repository.findById(id);
		if (order.isPresent()) {
			Order o = order.get();
			Product product = productClient.findById(o.getProductId());
			o.setProductName(product.getName());
			Customer customer = customerClient.findById(o.getCustomerId());
			o.setCustomerName(customer.getName());
			return o;
		} else {
			return null;
		}
	}

	// ...

}

Chaos Monkey sets random latency between 1000 and 10000 milliseconds (as shown in the step 3). It is important to change default timeouts for Feign and Ribbon clients before starting a test. I decided to set readTimeout to 5000 milliseconds. It will cause some delayed requests to be timed out, while some will succeeded (around 50%-50%). Here’s timeouts configuration for Feign client.

feign:
  client:
    config:
      default:
        connectTimeout: 5000
        readTimeout: 5000
  hystrix:
    enabled: false

Here’s Ribbon client timeouts configuration for API gateway. We have also changed Hystrix settings to disable circuit breaker for Zuul.

ribbon:
  ConnectTimeout: 5000
  ReadTimeout: 5000

hystrix:
  command:
    default:
      execution:
        isolation:
          thread:
            timeoutInMilliseconds: 15000
      fallback:
        enabled: false
      circuitBreaker:
        enabled: false

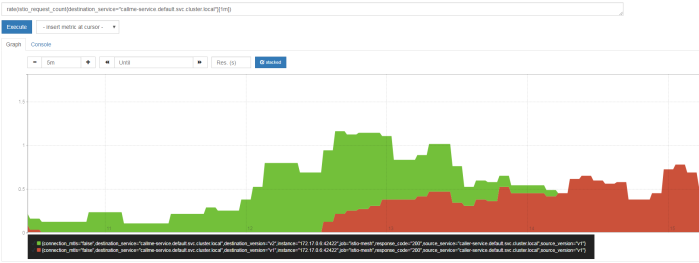
To launch Gatling performance test go to performance-test directory and run gradle loadTest command. Here’s a result generated for the settings latency assaults. Of course, we can change this result by manipulating Chaos Monkey latency values or Ribbon and Feign timeout values.

chaos-5

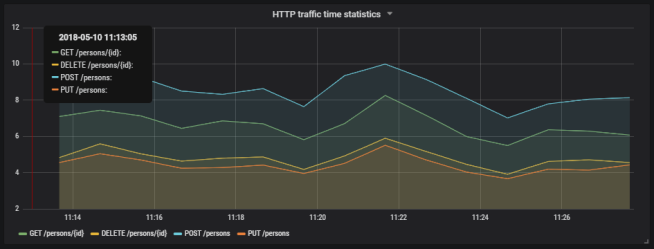
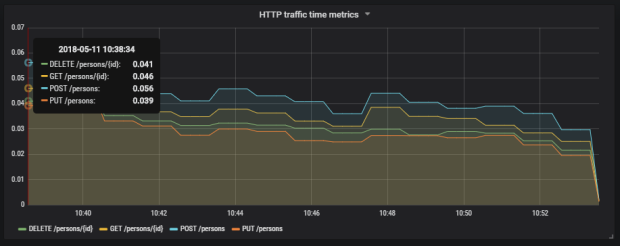
Here’s Gatling graph with average response times. Results do not look good. However, we should remember that a single POST method from order-service calls two methods exposed by product-service and two methods exposed by customer-service.

chaos-6

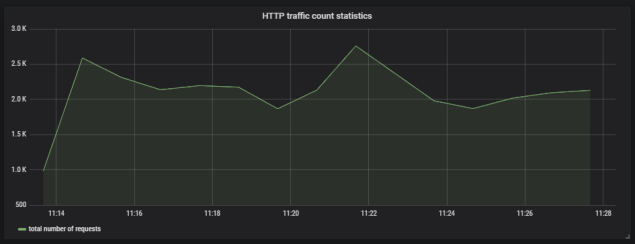
Here’s the next Gatling result graph – this time it illustrates timeline with error and success responses. All HTML reports generated by Gatling during performance test are available under directory performance-test/build/gatling-results

chaos-7

Secure Discovery with Spring Cloud Netflix Eureka

Building standard discovery mechanism basing on Spring Cloud Netflix Eureka is rather an easy thing to do. The same solution built over secure SSL communication between discovery client and server may be slightly more advanced challenge. I haven’t find any any complete example of such an application on web. Let’s try to implement it beginning from the server-side application.

1. Generate certificates

If you develop Java applications for some years you have probably heard about keytool. This tool is available in your ${JAVA_HOME}\bin directory, and is designed for managing keys and certificates. We begin from generating keystore for server-side Spring Boot application. Here’s the appropriate keytool command that generates certficate stored inside JKS keystore file named eureka.jks.

secure-discovery-2

2. Setting up a secure discovery server

Since Eureka server is embedded to Spring Boot application, we need to secure it using standard Spring Boot properties. I placed generated keystore file eureka.jks on the application’s classpath. Now, the only thing that has to be done is to prepare some configuration settings inside application.yml that point to keystore file location, type, and access password.

server:
  port: 8761
  ssl:
    enabled: true
    key-store: classpath:eureka.jks
    key-store-password: 123456
    trust-store: classpath:eureka.jks
    trust-store-password: 123456
    key-alias: eureka

3. Setting up two-way SSL authentication

We will complicate our example a little. A standard SSL configuration assumes that only the client verifies the server certificate. We will force client’s certificate authentication on the server-side. It can be achieved by setting the property server.ssl.client-auth to need.

server:
  ssl:
    client-auth: need

It’s not all, because we also have to add client’s certficate to the list of trusted certificates on the server-side. So, first let’s generate client’s keystore using the same keytool command as for server’s keystore.

secure-deiscovery-1

Now, we need to export certficates from generated keystores for both client and server sides.

secure-discovery-3

Finally, we import client’s certficate to server’s keystore and server’s certficate to client’s keystore.

secure-discovery-4

4. Running secure Eureka server

The sample applications are available on GitHub in repository sample-secure-eureka-discovery (https://github.com/piomin/sample-secure-eureka-discovery.git). After running discovery-service application, Eureka is available under address https://localhost:8761. If you try to visit its web dashboard you get the following exception in your web browser. It means Eureka server is secured.

hqdefault

Well, Eureka dashboard is sometimes an useful tool, so let’s import client’s keystore to our web browser to be able to access it. We have to convert client’s keystore from JKS to PKCS12 format. Here’s the command that performs mentioned operation.

$ keytool -importkeystore -srckeystore client.jks -destkeystore client.p12 -srcstoretype JKS -deststoretype PKCS12 -srcstorepass 123456 -deststorepass 123456 -srcalias client -destalias client -srckeypass 123456 -destkeypass 123456 -noprompt

5. Client’s application configuration

When implementing secure connection on the client side, we generally need to do the same as in the previous step – import a keystore. However, it is not very simple thing to do, because Spring Cloud does not provide any configuration property that allows you to pass the location of SSL keystore to a discovery client. What’s worth mentioning Eureka client leverages Jersey client to communicate with server-side application. It may be surprising a little it is not Spring RestTemplate, but we should remember that Spring Cloud Eureka is built on top of Netflix OSS Eureka client, which does not use Spring libraries.
HTTP basic authentication is automatically added to your eureka client if you include security credentials to connection URL, for example http://piotrm:12345@localhost:8761/eureka. For more advanced configuration, like passing SSL keystore to HTTP client we need to provide @Bean of type DiscoveryClientOptionalArgs.
The following fragment of code shows how to enable SSL connection for discovery client. First, we set location of keystore and truststore files using javax.net.ssl.* Java system property. Then, we provide custom implementation of Jersey client based on Java SSL settings, and set it for DiscoveryClientOptionalArgs bean.

@Bean
public DiscoveryClient.DiscoveryClientOptionalArgs discoveryClientOptionalArgs() throws NoSuchAlgorithmException {
	DiscoveryClient.DiscoveryClientOptionalArgs args = new DiscoveryClient.DiscoveryClientOptionalArgs();
	System.setProperty("javax.net.ssl.keyStore", "src/main/resources/client.jks");
	System.setProperty("javax.net.ssl.keyStorePassword", "123456");
	System.setProperty("javax.net.ssl.trustStore", "src/main/resources/client.jks");
	System.setProperty("javax.net.ssl.trustStorePassword", "123456");
	EurekaJerseyClientBuilder builder = new EurekaJerseyClientBuilder();
	builder.withClientName("account-client");
	builder.withSystemSSLConfiguration();
	builder.withMaxTotalConnections(10);
	builder.withMaxConnectionsPerHost(10);
	args.setEurekaJerseyClient(builder.build());
	return args;
}

6. Enabling HTTPS on the client side

The configuration provided in the previous step applies only to communication between discovery client and Eureka server. What if we also would like to secure HTTP endpoints exposed by the client-side application? The first step is pretty the same as for the discovery server: we need to generate keystore and set it using Spring Boot properties inside application.yml.

server:
  port: ${PORT:8090}
  ssl:
    enabled: true
    key-store: classpath:client.jks
    key-store-password: 123456
    key-alias: client

During registration we need to “inform” Eureka server that our application’s endpoints are secured. To achieve it we should set property eureka.instance.securePortEnabled to true, and also disable non secure port, which is enabled by default.with nonSecurePortEnabled property.

eureka:
  instance:
    nonSecurePortEnabled: false
    securePortEnabled: true
    securePort: ${server.port}
    statusPageUrl: https://localhost:${server.port}/info
    healthCheckUrl: https://localhost:${server.port}/health
    homePageUrl: https://localhost:${server.port}
  client:
    securePortEnabled: true
    serviceUrl:
      defaultZone: https://localhost:8761/eureka/

7. Running client’s application

Finally, we can run client-side application. After launching the application should be visible in Eureka Dashboard.

secure-discovery-5

All the client application’s endpoints are registred in Eureka under HTTPS protocol. I have also override default implementation of actuator endpoint /info, as shown on the code fragment below.

@Component
public class SecureInfoContributor implements InfoContributor {

	@Override
	public void contribute(Builder builder) {
		builder.withDetail("hello", "I'm secure app!");
	}

}

Now, we can try to visit /info endpoint one more time. You should see the same information as below.

secure-discovery-6

Alternatively, if you try to set on the client-side the certificate, which is not trusted by server-side, you will see the following exception while starting your client application.

secure-discovery-7

Conclusion

Securing connection between microservices and Eureka server is only the first step of securing the whole system. We need to thing about secure connection between microservices and config server, and also between all microservices during inter-service communication with @LoadBalanced RestTemplate or OpenFeign client. You can find the examples of such implementations and many more in my book “Mastering Spring Cloud” (https://www.packtpub.com/application-development/mastering-spring-cloud).

Quick guide to deploying Java apps on OpenShift

In this article I’m going to show you how to deploy your applications on OpenShift (Minishift), connect them with other services exposed there or use some other interesting deployment features provided by OpenShift. Openshift is built on top of Docker containers and the Kubernetes container cluster orchestrator. Currently, it is the most popular enterprise platform basing on those two technologies, so it is definitely worth examining it in more details.

1. Running Minishift

We use Minishift to run a single-node OpenShift cluster on the local machine. The only prerequirement before installing MiniShift is the necessity to have a virtualization tool installed. I use Oracle VirtualBox as a hypervisor, so I should set --vm-driver parameter to virtualbox in my running command.

$  minishift start --vm-driver=virtualbox --memory=3G

2. Running Docker

It turns out that you can easily reuse the Docker daemon managed by Minishift, in order to be able to run Docker commands directly from your command line, without any additional installations. To achieve this just run the following command after starting Minishift.

@FOR /f "tokens=* delims=^L" %i IN ('minishift docker-env') DO @call %i

3. Running OpenShift CLI

The last tool, that is required before starting any practical exercise with Minishift is CLI. CLI is available under command oc. To enable it on your command-line run the following commands.

$ minishift oc-env
$ SET PATH=C:\Users\minkowp\.minishift\cache\oc\v3.9.0\windows;%PATH%
$ REM @FOR /f "tokens=*" %i IN ('minishift oc-env') DO @call %i

Alternatively you can use OpenShift web console which is available under port 8443. On my Windows machine it is by default launched under address 192.168.99.100.

4. Building Docker images of the sample applications

I prepared the two sample applications that are used for the purposes of presenting OpenShift deployment process. These are simple Java, Vert.x applications that provide HTTP API and store data in MongoDB. However, a technology is not very important now. We need to build Docker images with these applications. The source code is available on GitHub (https://github.com/piomin/sample-vertx-kubernetes.git) in branch openshift (https://github.com/piomin/sample-vertx-kubernetes/tree/openshift). Here’s sample Dockerfile for account-vertx-service.

FROM openjdk:8-jre-alpine
ENV VERTICLE_FILE account-vertx-service-1.0-SNAPSHOT.jar
ENV VERTICLE_HOME /usr/verticles
ENV DATABASE_USER mongo
ENV DATABASE_PASSWORD mongo
ENV DATABASE_NAME db
EXPOSE 8095
COPY target/$VERTICLE_FILE $VERTICLE_HOME/
WORKDIR $VERTICLE_HOME
ENTRYPOINT ["sh", "-c"]
CMD ["exec java -jar $VERTICLE_FILE"]

Go to account-vertx-service directory and run the following command to build image from a Dockerfile visible above.

$ docker build -t piomin/account-vertx-service .

The same step should be performed for customer-vertx-service. After it you have two images built, both in the same version latest, which now can be deployed and ran on Minishift.

5. Preparing OpenShift deployment descriptor

When working with OpenShift, the first step of application’s deployment is to create YAML configuration file. This file contains basic information about deployment like containers used for running applications (1), scaling (2), triggers that drive automated deployments in response to events (3) or a strategy of deploying your pods on the platform (4).

Deployment configurations can be managed with the oc command like any other resource. You can create new configuration or update the existing one by using oc apply command.

$ oc apply -f account-deployment.yaml

You can be surprised a little, but this command does not trigger any build and does not start the pods. In fact, you have only created a resource of type deploymentConfig, which may be describes deployment process. You can start this process using some other oc commands, but first let’s take a closer look on the resources required by our application.

6. Injecting environment variables

As I have mentioned before, our sample applications uses external datasource. They need to open the connection to the existing MongoDB instance in order to store there data passed using HTTP endpoints exposed by the application. Here’s MongoVerticle class, which is responsible for establishing client connection with MongoDB. It uses environment variables for setting security credentials and database name.

public class MongoVerticle extends AbstractVerticle {

	@Override
	public void start() throws Exception {
		ConfigStoreOptions envStore = new ConfigStoreOptions()
				.setType("env")
				.setConfig(new JsonObject().put("keys", new JsonArray().add("DATABASE_USER").add("DATABASE_PASSWORD").add("DATABASE_NAME")));
		ConfigRetrieverOptions options = new ConfigRetrieverOptions().addStore(envStore);
		ConfigRetriever retriever = ConfigRetriever.create(vertx, options);
		retriever.getConfig(r -> {
			String user = r.result().getString("DATABASE_USER");
			String password = r.result().getString("DATABASE_PASSWORD");
			String db = r.result().getString("DATABASE_NAME");
			JsonObject config = new JsonObject();
			config.put("connection_string", "mongodb://" + user + ":" + password + "@mongodb/" + db);
			final MongoClient client = MongoClient.createShared(vertx, config);
			final AccountRepository service = new AccountRepositoryImpl(client);
			ProxyHelper.registerService(AccountRepository.class, vertx, service, "account-service");
		});
	}

}

MongoDB is available in the OpenShift’s catalog of predefined Docker images. You can easily deploy it on your Minishift instance just by clicking “MongoDB” icon in “Catalog” tab. Username and password will be automatically generated if you do not provide them during deployment setup. All the properties are available as deployment’s environment variables and are stored as secrets/mongodb, where mongodb is the name of the deployment.

openshift-1

Environment variables can be easily injected into any other deployment using oc set command, and therefore they are injected into the pod after performing deployment process. The following command inject all secrets assigned to mongodb deployment to the configuration of our sample application’s deployment.

$ oc set env --from=secrets/mongodb dc/account-service

7. Importing Docker images to OpenShift

A deployment configuration is ready. So, in theory we could have start deployment process. However, we have back for a moment to the deployment config defined in the Step 5. We defined there two triggers that causes a new replication controller to be created, what results in deploying new version of pod. First of them is a configuration change trigger that fires whenever changes are detected in the pod template of the deployment configuration (ConfigChange). The second of them, image change trigger (ImageChange) fires when a new version of the Docker image is pushed to the repository. To be able to watch if an image in repository has been changed, we have to define and create image stream. Such an image stream does not contain any image data, but present a single virtual view of related images, something similar to an image repository. Inside deployment config file we referred to image stream account-vertx-service, so the same name should be provided inside image stream definition. In turn, when setting the spec.dockerImageRepository field we define the Docker pull specification for the image.

Finally, we can create resource on OpenShift platform.

$ oc apply -f account-image.yaml

8. Running deployment

Once a deployment configuration has been prepared, and Docker images has been succesfully imported into repository managed by OpenShift instance, we may trigger the build using the following oc command.

$ oc rollout latest dc/account-service
$ oc rollout latest dc/customer-service

If everything goes fine the new pods should be started for the defined deployments. You can easily check it out using OpenShift web console.

9. Updating image stream

We have already created two image streams related to the Docker repositories. Here’s the screen from OpenShift web console that shows the list of available image streams.

openshift-images

To be able to push a new version of an image to OpenShift internal Docker registry we should first perform docker login against this registry using user’s authentication token. To obtain the token from OpenShift use oc whoami command, and then pass it to your docker login command with -p parameter.

$ oc whoami -t
Sz9_TXJQ2nyl4fYogR6freb3b0DGlJ133DVZx7-vMFM
$ docker login -u developer -p Sz9_TXJQ2nyl4fYogR6freb3b0DGlJ133DVZx7-vMFM https://172.30.1.1:5000

Now, if you perform any change in your application and rebuild your Docker image with latest tag, you have to push that image to image stream on OpenShift. The address of internal registry has been automatically generated by OpenShift, and you can check it out in the image stream’s details. For me, it is 172.30.1.1:5000.

$ docker tag piomin/account-vertx-service 172.30.1.1:5000/sample-deployment/account-vertx-service:latest
$ docker push 172.30.1.1:5000/sample-deployment/account-vertx-service

After pushing new version of Docker image to image stream, a rollout of application is started automatically. Here’s the screen from OpenShift web console that shows the history of account-service application deployments.

openshift-2

Conclusion

I have shown you the further steps of deploying your application on the OpenShift platform. Basing on sample Java application that connects to a database, I illustrated how to inject credentials to that application’s pod entirely transparently for a developer. I also perform an update of application’s Docker image, in order to show how to trigger a new version deployment on image change.

openshift-3

Exporting metrics to InfluxDB and Prometheus using Spring Boot Actuator

Spring Boot Actuator is one of the most modified projects after release of Spring Boot 2. It has been through the major improvements, which aimed to simplify customization, and include some new features like support for other web technologies, for example the new reactive module – Spring WebFlux. It also adds out-of-the-box support for exporting metrics to InfluxDB – an open source time series database designed to handle high volumes of timestamped data.  It is really a great simplification in comparison to the version used with Spring Boot 1.5. You can see for yourself how much by reading one of my previous articles Custom metrics visualization with Grafana and InfluxDB. I described there how to export metrics generated by Spring Boot Actuator to InfluxDB using @ExportMetricsWriter bean. The sample Spring Boot application has been available for that article on GitHub repository sample-spring-graphite (https://github.com/piomin/sample-spring-graphite.git) in the branch master. For the current article, I have created the branch spring2 (https://github.com/piomin/sample-spring-graphite/tree/spring2), which show how to implement the same feature as before using version 2.0 of Spring Boot and Spring Boot Actuator.

Additionally, I’m going to show you how to export the same metrics to another popular monitoring system for efficiently storing timeseries data – Prometheus. There is one major difference between models of exporting metrics between InfluxDB and Prometheus. First of them is a push based system, while the second is a pull based system. So, our sample application needs to to actively send data to the InfluxDB monitoring system, while with Prometheus it only has to expose endpoint that will be fetched for data periodically. Let’s begin from InfluxDB.

1. Running InfluxDB

In the previous article I didn’t write much about this database and its configuration. So, now I say some words about it. First step is typical for my examples – we will run Docker container with InfluxDB. Here’s the simplest command that run InfluxDB on your local machine and exposes HTTP API over 8086 port.

$ docker run -d --name influx -p 8086:8086 influxdb

Once we started that container, you would probably want to login there and execute some commands. Nothing simpler, just run the following command and you would be able to do it. After login you should see the version of InfluxDB running on the target Docker container.

$ docker exec -it influx influx
Connected to http://localhost:8086 version 1.5.2
InfluxDB shell version: 1.5.2

The first step is to create database. As you can probably guess, tt can be achieved using command create database. Then switch to the newly created database.

$ create database springboot
$ use springboot

Is that semantic looks familiar for you? Yes, InfluxDB provides very similar query language to SQL. It is called InluxQL, and allows you to define SELECT statements, GROUP BY or INTO clauses, and many more. However, before executing such queries, we should have data stored inside database, am I right? Now, let’s proceed to the next steps in order to generate some test metrics.

2. Integrating Spring Boot application with InfluxDB

If you include artifact micrometer-registry-influx to the project’s dependencies, an export to InfluxDB will be enabled automatically. Of course, we also need to include starter spring-boot-starter-actuator.

<dependency>
	<groupId>org.springframework.boot</groupId>
	<artifactId>spring-boot-starter-actuator</artifactId>
</dependency>
<dependency>
	<groupId>io.micrometer</groupId>
	<artifactId>micrometer-registry-influx</artifactId>
</dependency>

The only thing you have to do is to override default address of InfluxDB, because we are running InfluxDB Docker container on VM. By default, Spring Boot Data tries to connect database named mydb. However, I have already created database springboot, so I should also override this default value. In the version 2 of Spring Boot all the configuration properties related to Spring Boot Actuator endpoints has been moved to management.* section.

management:
  metrics:
    export:
      influx:
        db: springboot
        uri: http://192.168.99.100:8086

You may be surprised a little after starting Spring Boot application with actuator included on the classpath, that it exposes only two HTTP endpoints by default /actuator/info and /actuator/health. That’s why in the newest version of Spring Boot all actuators other than /health and /info are disabled by default, for security purposes. To enable all the actuator enpoints, you have to set property management.endpoints.web.exposure.include to '*'.
In the newest version of Spring Boot monitoring of HTTP metrics has been improved significantly. We can enable collecting all Spring MVC metrics by setting the property management.metrics.web.server.auto-time-requests to true. Alternatively, when it is set to false, you can enable metrics for the specific REST controller by annotating it with @Timed. You can also annotate a single method inside controller, to generate metrics only for specific endpoint.
After application boot you may check out the full list of generated metrics by calling endpoint GET /actuator/metrics. By default, metrics for Spring MVC controller are generated under the name http.server.requests. This name can be customized by setting the management.metrics.web.server.requests-metric-name property. If you run the sample application available inside my GitHub repository it is by default available uder port 2222. Now, you can check out the list of statistics generated for a single metric by calling the endpoint GET /actuator/metrics/{requiredMetricName}, as shown in the following picture.

actuator-6

3. Building Spring Boot application

The sample Spring Boot application used for generating metrics consists of a single controller that implements basic CRUD operations for manipulating Person entity, repository bean and entity class. The application connects to MySQL database using Spring Data JPA repository providing CRUD implementation. Here’s the controller class.

@RestController
@Timed
public class PersonController {

	protected Logger logger = Logger.getLogger(PersonController.class.getName());

	@Autowired
	PersonRepository repository;

	@GetMapping("/persons/pesel/{pesel}")
	public List findByPesel(@PathVariable("pesel") String pesel) {
		logger.info(String.format("Person.findByPesel(%s)", pesel));
		return repository.findByPesel(pesel);
	}

	@GetMapping("/persons/{id}")
	public Person findById(@PathVariable("id") Integer id) {
		logger.info(String.format("Person.findById(%d)", id));
		return repository.findById(id).get();
	}

	@GetMapping("/persons")
	public List findAll() {
		logger.info(String.format("Person.findAll()"));
		return (List) repository.findAll();
	}

	@PostMapping("/persons")
	public Person add(@RequestBody Person person) {
		logger.info(String.format("Person.add(%s)", person));
		return repository.save(person);
	}

	@PutMapping("/persons")
	public Person update(@RequestBody Person person) {
		logger.info(String.format("Person.update(%s)", person));
		return repository.save(person);
	}

	@DeleteMapping("/persons/{id}")
	public void remove(@PathVariable("id") Integer id) {
		logger.info(String.format("Person.remove(%d)", id));
		repository.deleteById(id);
	}

}

Before running the application we have setup MySQL database. The most convenient way to achieve it is through MySQL Docker image. Here’s the command that runs container with database grafana, defines user and password, and exposes MySQL 5 on port 33306.

docker run -d --name mysql -e MYSQL_DATABASE=grafana -e MYSQL_USER=grafana -e MYSQL_PASSWORD=grafana -e MYSQL_ALLOW_EMPTY_PASSWORD=yes -p 33306:3306 mysql:5

Then we need to set some database configuration properties on the application side. All the required tables will be created on application’s boot thanks to setting property spring.jpa.properties.hibernate.hbm2ddl.auto to update.

spring:
  datasource:
    url: jdbc:mysql://192.168.99.100:33306/grafana?useSSL=false
    username: grafana
    password: grafana
    driverClassName: com.mysql.jdbc.Driver
  jpa:
    properties:
      hibernate:
        dialect: org.hibernate.dialect.MySQL5Dialect
        hbm2ddl.auto: update

4. Generating metrics

After starting the application and the required Docker containers, the only thing that needs to be is done is to generate some test statistics. I created JUnit test class that generates some test data and calls endpoints exposed by the application in a loop. Here’s the fragment of that test method.

int ix = new Random().nextInt(100000);
Person p = new Person();
p.setFirstName("Jan" + ix);
p.setLastName("Testowy" + ix);
p.setPesel(new DecimalFormat("0000000").format(ix) + new DecimalFormat("000").format(ix%100));
p.setAge(ix%100);
p = template.postForObject("http://localhost:2222/persons", p, Person.class);
LOGGER.info("New person: {}", p);

p = template.getForObject("http://localhost:2222/persons/{id}", Person.class, p.getId());
p.setAge(ix%100);
template.put("http://localhost:2222/persons", p);
LOGGER.info("Person updated: {} with age={}", p, ix%100);

template.delete("http://localhost:2222/persons/{id}", p.getId());

Now, let’s move back to the step 1. As you probably remember, I have shown you how to run the influx client in the InfluxDB Docker container. After some minutes of working test unit should call exposed endpoints many times. We can check out the values of metric http_server_requests stored on Influx. The following query returns list of measurements collected during last 3 minutes.

actuator-1

As you see, all the metrics generated by Spring Boot Actuator are tagged with the following information: method, uri, status and exception. Thanks to that tags we may easily group metrics per signle endpoint including failures and success percentage. Let’s see how to configure and view it in Grafana.

5. Metrics visualization using Grafana

Once we have exported succesfully metrics to InfluxDB, it is time to visualize them using Grafana. First, let’s run Docker container with Grafana.

$ docker run -d --name grafana -p 3000:3000 grafana/grafana

Grafana provides user friedly interface for creating influx queries. We define a graph that visualizes requests processing time per each of calling endpoints and total number of requests received by the application. If we filter the statistics stored in the table http_server_requests by method type and uri, we would collect all metrics generated per single endpoint.

actuator-4

The similar definition should be created for the other endpoints. We will illustrate them all on a single graph.

actuator-5

Here’s the final result.

actuator-2

Here’s the graph that visualizes total number of requests sent to the application.

actuator-3

6. Running Prometheus

The most suitable way to run Prometheus locally is obviously through a Docker container. The API is exposed under port 9090. We should also pass the initial configuration file and name of Docker network. Why? You will find all the anwers in the next part of this step description.

docker run -d --name prometheus -p 9090:9090 -v /tmp/prometheus.yml:/etc/prometheus/prometheus.yml --network springboot prom/prometheus

In contrast to InfluxDB, Prometheus pulls metrics from an application. Therefore, we need to enable actuator endpoint that exposes metrics for Prometheus, which is disabled by default. To enable it, set property management.endpoint.prometheus.enabled to true, as shown on the configuration fragment below.

management:
  endpoint:
    prometheus:
	  enabled: true

Then we should set the address of actuator endpoint exposed by the application in Prometheus configuration file. A scrape_config section is responsible for specifying a set of targets and parameters describing how to connect with them. By default, Prometheus tries to collect data from defined target endpoint once a minute.

scrape_configs:
  - job_name: 'springboot'
    metrics_path: '/actuator/prometheus'
    static_configs:
    - targets: ['person-service:2222']

The similar as for integration with InfluxDB we need to include the following artifact to the project’s dependencies.

<dependency>
	<groupId>io.micrometer</groupId>
	<artifactId>micrometer-registry-prometheus</artifactId>
</dependency>

In my case, Docker is running on VM, and is available under IP 192.168.99.100. If I would like Prometheus, which is launched as a Docker container, to be able to connect my application, I also should launch it as Docker container. The most convenient way to link two independent containers is through Docker network. If both containers are assigned to the same network, they would be able to connect to each other using container’s name as a target address. Dockerfile is available in the root directory of the sample application’s source code. Second command visible below (docker build) is not required, because the required image piomin/person-service is available on my Docker Hub repository.

$ docker network create springboot
$ docker build -t piomin/person-service .
$ docker run -d --name person-service -p 2222:2222 --network springboot piomin/person-service

7. Integrate Prometheus with Grafana

Prometheus exposes web console under address 192.168.99.100:9090, where you can specify query and display graph with metrics. However, we can integrate it with Grafana to take an advantage of nicer visualization offered by this tool. First, you should create Prometheus data source.

actuator-9

Then we should define queries for collecting metrics from Prometheus API. Spring Boot Actuator exposes three different metrics related to HTTP traffic: http_server_requests_seconds_counthttp_server_requests_seconds_sum and http_server_requests_seconds_max. For example, we may calculate per-second average rate of increase of the time series for http_server_requests_seconds_sum, that returns total number of seconds spent on processing requests by using rate() function. The values can be filtered by method and uri using expression inside {}. The following picture illustrates configuration of rate() function per each endpoint.

actuator-8

Here’s the graph.

actuator-7

Summary

The improvement in metrics generation between version 1.5 and 2.0 of Spring Boot is significant. Exporting data to such the popular monitoring systems like InfluxDB or Prometheus is now much easier then before, and does not require any additional development. The metrics relating to HTTP traffic are more detailed and they may be easily associated with specific endpoint, thanks to tags indicating the uri, type and status of HTTP request. I think that modifications in Spring Boot Actuator in relation to the previous version of Spring Boot, could be one of the main motivation to migrate your applications to the newest version.

Microservices traffic management using Istio on Kubernetes

I have already described a simple example of route configuration between two microservices deployed on Kubernetes in one of my previous articles: Service Mesh with Istio on Kubernetes in 5 steps. You can refer to this article if you are interested in the basic information about Istio, and its deployment on Kubernetes via Minikube. Today we will create some more advanced traffic management rules basing on the same sample applications as used in the previous article about Istio.

The source code of sample applications is available on GitHub in repository sample-istio-services (https://github.com/piomin/sample-istio-services.git). There are two sample application callme-service and caller-service deployed in two different versions 1.0 and 2.0. Version 1.0 is available in branch v1 (https://github.com/piomin/sample-istio-services/tree/v1), while version 2.0 in the branch v2 (https://github.com/piomin/sample-istio-services/tree/v2). Using these sample applications in different versions I’m going to show you different strategies of traffic management depending on a HTTP header set in the incoming requests.

We may force caller-service to route all the requests to the specific version of callme-service by setting header x-version to v1 or v2. We can also do not set this header in the request what results in splitting traffic between all existing versions of service. If the request comes to version v1 of caller-service the traffic is splitted 50-50 between two instances of callme-service. If the request is received by v2 instance of caller-service 75% traffic is forwarded to version v2 of callme-service, while only 25% to v1. The scenario described above has been illustrated on the following diagram.

istio-advanced-1

Before we proceed to the example, I should say some words about traffic management with Istio. If you have read my previous article about Istio, you would probably know that each rule is assigned to a destination. Rules control a process of requests routing within a service mesh. The one very important information about them,especially for the purposes of the example illustrated on the diagram above, is that multiple rules can be applied to the same destination. The priority of every rule is determined by the precedence field of the rule. There is one principle related to a value of this field: the higher value of this integer field, the greater priority of the rule. As you may probably guess, if there is more than one rule with the same precedence value the order of rules evaluation is undefined. In addition to a destination, we may also define a source of the request in order to restrict a rule only to a specific caller. If there are multiple deployments of a calling service, we can even filter them out by setting source’s label field. Of course, we can also specify the attributes of an HTTP request such as uri, scheme or headers that are used for matching a request with defined rule.

Ok, now let’s take a look on the rule with the highest priority. Its name is callme-service-v1 (1). It applies to callme-service (2),  and has the highest priority in comparison to other rules (3). It is applies only to requests sent by caller-service (4), that contain HTTP header x-version with value v1 (5). This route rule applies only to version v1 of callme-service (6).

apiVersion: config.istio.io/v1alpha2
kind: RouteRule
metadata:
  name: callme-service-v1 # (1)
spec:
  destination:
    name: callme-service # (2)
  precedence: 4 # (3)
  match:
    source:
      name: caller-service # (4)
    request:
      headers:
        x-version:
          exact: "v1" # (5)
  route:
  - labels:
      version: v1 # (6)

Here’s the fragment of the first diagram, which is handled by this route rule.

istio-advanced-7

The next rule callme-service-v2 (1) has a lower priority (2). However, it does not conflicts with first rule, because it applies only to the requests containing x-version header with value v2 (3). It forwards all requests to version v2 of callme-service (4).

apiVersion: config.istio.io/v1alpha2
kind: RouteRule
metadata:
  name: callme-service-v2 # (1)
spec:
  destination:
    name: callme-service
  precedence: 3 # (2)
  match:
    source:
      name: caller-service
    request:
      headers:
        x-version:
          exact: "v2" # (3)
  route:
  - labels:
      version: v2 # (4)

As before, here’s the fragment of the first diagram, which is handled by this route rule.

istio-advanced-6

The rule callme-service-v1-default (1) visible in the code fragment below has a lower priority (2) than two previously described rules. In practice it means that it is executed only if conditions defined in two previous rules were not fulfilled. Such a situation occurs if you do not pass the header x-version inside HTTP request, or it would have diferent value than v1 or v2. The rule visible below applies only to the instance of service labeled with v1 version (3). Finally, the traffic to callme-service is load balanced in propertions 50-50 between two versions of that service (4).

apiVersion: config.istio.io/v1alpha2
kind: RouteRule
metadata:
  name: callme-service-v1-default # (1)
spec:
  destination:
    name: callme-service
  precedence: 2 # (2)
  match:
    source:
      name: caller-service
      labels:
        version: v1 # (3)
  route: # (4)
  - labels:
      version: v1
    weight: 50
  - labels:
      version: v2
    weight: 50

Here’s the fragment of the first diagram, which is handled by this route rule.

istio-advanced-4

The last rule is pretty similar to the previously described callme-service-v1-default. Its name is callme-service-v2-default (1), and it applies only to version v2 of caller-service (3). It has the lowest priority (2), and splits traffic between two version of callme-service in proportions 75-25 in favor of version v2 (4).

apiVersion: config.istio.io/v1alpha2
kind: RouteRule
metadata:
  name: callme-service-v2-default # (1)
spec:
  destination:
    name: callme-service
  precedence: 1 # (2)
  match:
    source:
      name: caller-service
      labels:
        version: v2 # (3)
  route: # (4)
  - labels:
      version: v1
    weight: 25
  - labels:
      version: v2
    weight: 75

The same as before, I have also included the diagram illustrated a behaviour of this rule.

istio-advanced-5

All the rules may be placed inside a single file. In that case they should be separated with line ---. This file is available in code’s repository inside callme-service module as multi-rule.yaml. To deploy all defined rules on Kubernetes just execute the following command.

$ kubectl apply -f multi-rule.yaml

After successful deploy you may check out the list of available rules by running command istioctl get routerule.

istio-advanced-2

Before we will start any tests, we obviously need to have sample applications deployed on Kubernetes. This applications are really simple and pretty similar to the applications used for tests in my previous article about Istio. The controller visible below implements method GET /callme/ping, which prints version of application taken from pom.xml and value of x-version HTTP header received in the request.

@RestController
@RequestMapping("/callme")
public class CallmeController {

	private static final Logger LOGGER = LoggerFactory.getLogger(CallmeController.class);

	@Autowired
	BuildProperties buildProperties;

	@GetMapping("/ping")
	public String ping(@RequestHeader(name = "x-version", required = false) String version) {
		LOGGER.info("Ping: name={}, version={}, header={}", buildProperties.getName(), buildProperties.getVersion(), version);
		return buildProperties.getName() + ":" + buildProperties.getVersion() + " with version " + version;
	}

}

Here’s the controller class that implements method GET /caller/ping. It prints version of caller-service taken from pom.xml and calls method GET callme/ping exposed by callme-service. It needs to include x-version header to the request when sending it to the downstream service.

@RestController
@RequestMapping("/caller")
public class CallerController {

	private static final Logger LOGGER = LoggerFactory.getLogger(CallerController.class);

	@Autowired
	BuildProperties buildProperties;
	@Autowired
	RestTemplate restTemplate;

	@GetMapping("/ping")
	public String ping(@RequestHeader(name = "x-version", required = false) String version) {
		LOGGER.info("Ping: name={}, version={}, header={}", buildProperties.getName(), buildProperties.getVersion(), version);
		HttpHeaders headers = new HttpHeaders();
		if (version != null)
			headers.set("x-version", version);<span id="mce_SELREST_start" style="overflow:hidden;line-height:0;"></span>
		HttpEntity entity = new HttpEntity(headers);
		ResponseEntity response = restTemplate.exchange("http://callme-service:8091/callme/ping", HttpMethod.GET, entity, String.class);
		return buildProperties.getName() + ":" + buildProperties.getVersion() + ". Calling... " + response.getBody() + " with header " + version;
	}

}

Now, we may proceeed to applications build and deployment on Kubernetes. Here are are the further steps.

1. Building appplication

First, switch to branch v1 and build the whole project sample-istio-services by executing mvn clean install command.

2. Building Docker image

The Dockerfiles are placed in the root directory of every application. Build their Docker images by executing the following commands.

$ docker build -t piomin/callme-service:1.0 .
$ docker build -t piomin/caller-service:1.0 .

Alternatively, you may omit this step, because images piomin/callme-service and piomin/caller-service are available on my Docker Hub account.

3. Inject Istio components to Kubernetes deployment file

Kubernetes YAML deployment file is available in the root directory of every application as deployment.yaml. The result of the following command should be saved as separated file, for example deployment-with-istio.yaml.

$ istioctl kube-inject -f deployment.yaml

4. Deployment on Kubernetes

Finally, you can execute well-known kubectl command in order to deploy Docker container with our sample application.

$ kubectl apply -f deployment-with-istio.yaml

Then switch to branch v2, and repeat the steps described above for version 2.0 of the sample applications. The final deployment result is visible on picture below.

istio-advanced-3

One very useful thing when running Istio on Kubernetes is out-of-the-box integration with such tools like Zipkin, Grafana or Prometheus. Istio automatically sends some metrics, that are collected by Prometheus, for example total number of requests in metric istio_request_count. YAML deployment files for these plugins ara available inside directory ${ISTIO_HOME}/install/kubernetes/addons. Before installing Prometheus using kubectl command I suggest to change service type from default ClusterIP to NodePort by adding the line type: NodePort.

apiVersion: v1
kind: Service
metadata:
  annotations:
    prometheus.io/scrape: 'true'
  labels:
    name: prometheus
  name: prometheus
  namespace: istio-system
spec:
  type: NodePort
  selector:
    app: prometheus
  ports:
  - name: prometheus
    protocol: TCP
    port: 9090

Then we should run command kubectl apply -f prometheus.yaml in order to deploy Prometheus on Kubernetes. The deployment is available inside istio-system namespace. To check the external port of service run the following command. For me, it is available under address http://192.168.99.100:32293.

istio-advanced-14

In the following diagram visualized using Prometheus I filtered out only the requests sent to callme-service. Green color points to requests received by version v2 of the service, while red color points to requests processed by version v1 of the service. Like you can see in this diagram, in the beginning I have sent the requests to caller-service with HTTP header x-version set to value v2, then I didn’t set this header and traffic has been splitted between to deployed instances of the service. Finally I set it to v1. I defined an expression rate(istio_request_count{callme-service.default.svc.cluster.local}[1m]), which returns per-second rate of requests received by callme-service.

istio-advanced-13

Testing

Before sending some test requests to caller-service we need to obtain its address on Kubernetes. After executing the following command you see that it is available under address http://192.168.99.100:32237/caller/ping.

istio-services-16

We have four possible scenarios. In first, when we set header x-version to v1 the request will be always routed to callme-service-v1.

istio-advanced-10

If a header x-version is not included in the requests the traffic will be splitted between callme-service-v1

istio-advanced-11

… and callme-service-v2.

istio-advanced-12

Finally, if we set header x-version to v2 the request will be always routed to callme-service-v2.

istio-advanced-14

Conclusion

Using Istio you can easily create and apply simple and more advanced traffic management rules to the applications deployed on Kubernetes. You can also monitor metrics and traces through the integration between Istio and Zipkin, Prometheus and Grafana.

Mastering Spring Cloud

Let me share with you the result of my last couple months of work – the book published on 26th April by Packt. The book Mastering Spring Cloud is strictly linked to the topics frequently published in this blog – it describes how to build microservices using Spring Cloud framework. I tried to create this book in well-known style of writing from this blog, where I focus on giving you the practical samples of working code without unnecessary small-talk and scribbles 🙂 If you like my style of writing, and in addition you are interested in Spring Cloud framework and microservices, this book is just for you 🙂

The book consists of fifteen chapters, where I have guided you from the basic to the most advanced examples illustrating use cases for almost all projects being a part of Spring Cloud. While creating a blog posts I not always have time to go into all the details related to Spring Cloud. I’m trying to describe a lot of different, interesting trends and solutions in the area of Java development. The book describes many details related to the most important projects of Spring Cloud like service discovery, distributed configuration, inter-service communication, security, logging, testing or continuous delivery. It is available on http://www.packtpub.com site: https://www.packtpub.com/application-development/mastering-spring-cloud. The detailed description of all the topics raised in that book is available on that site.

Personally, I particulary recommend to read the following more advanced subjects described in the book:

  • Peer-to-peer replication between multiple instances of Eureka servers, and using zoning mechanism in inter-service communication
  • Automatically reloading configuration after changes with Spring Cloud Config push notifications mechanism based on Spring Cloud Bus
  • Advanced configuration of inter-service communication with Ribbon client-side load balancer and Feign client
  • Enabling SSL secure communication between microservices and basic elements of microservices-based architecture like service discovery or configuration server
  • Building messaging microservices based on publish/subscribe communication model including cunsumer grouping, partitioning and scaling with Spring Cloud Stream and message brokers (Apache Kafka, RabbitMQ)
  • Setting up continuous delivery for Spring Cloud microservices with Jenkins and Docker
  • Using Docker for running Spring Cloud microservices on Kubernetes platform simulated locally by Minikube
  • Deploying Spring Cloud microservices on cloud platforms like Pivotal Web Services (Pivotal Cloud Foundry hosted cloud solution) and Heroku

Those examples and many others are available together with this book. At the end, a short description taken from packtpub.com site:

Developing, deploying, and operating cloud applications should be as easy as local applications. This should be the governing principle behind any cloud platform, library, or tool. Spring Cloud–an open-source library–makes it easy to develop JVM applications for the cloud. In this book, you will be introduced to Spring Cloud and will master its features from the application developer’s point of view.

Reactive Microservices with Spring WebFlux and Spring Cloud

I have already described Spring reactive support about one year ago in the article Reactive microservices with Spring 5. At that time project Spring WebFlux has been under active development, and now after official release of Spring 5 it is worth to take a look on the current version of it. Moreover, we will try to put our reactive microservices inside Spring Cloud ecosystem, which contains such the elements like service discovery with Eureka, load balancing with Spring Cloud Commons @LoadBalanced, and API gateway using Spring Cloud Gateway (also based on WebFlux and Netty). We will also check out Spring reactive support for NoSQL databases by the example of Spring Data Reactive Mongo project.

Here’s the figure that illustrates an architecture of our sample system consisting of two microservices, discovery server, gateway and MongoDB databases. The source code is as usual available on GitHub in sample-spring-cloud-webflux repository.

reactive-1

Let’s describe the further steps on the way to create the system illustrated above.

Step 1. Building reactive application using Spring WebFlux

To enable library Spring WebFlux for the project we should include starter spring-boot-starter-webflux to the dependencies. It includes some dependent libraries like Reactor or Netty server.

<dependency>
	<groupId>org.springframework.boot</groupId>
	<artifactId>spring-boot-starter-webflux</artifactId>
</dependency>

REST controller looks pretty similar to the controller defined for synchronous web services. The only difference is in type of returned objects. Instead of single object we return instance of class Mono, and instead of list we return instance of class Flux. Thanks to Spring Data Reactive Mongo we don’t have to do nothing more that call the needed method on the repository bean.

@RestController
public class AccountController {

	private static final Logger LOGGER = LoggerFactory.getLogger(AccountController.class);

	@Autowired
	private AccountRepository repository;

	@GetMapping("/customer/{customer}")
	public Flux findByCustomer(@PathVariable("customer") String customerId) {
		LOGGER.info("findByCustomer: customerId={}", customerId);
		return repository.findByCustomerId(customerId);
	}

	@GetMapping
	public Flux findAll() {
		LOGGER.info("findAll");
		return repository.findAll();
	}

	@GetMapping("/{id}")
	public Mono findById(@PathVariable("id") String id) {
		LOGGER.info("findById: id={}", id);
		return repository.findById(id);
	}

	@PostMapping
	public Mono create(@RequestBody Account account) {
		LOGGER.info("create: {}", account);
		return repository.save(account);
	}

}

Step 2. Integrate an application with database using Spring Data Reactive Mongo

The implementation of integration between application and database is also very simple. First, we need to include starter spring-boot-starter-data-mongodb-reactive to the project dependencies.

<dependency>
	<groupId>org.springframework.boot</groupId>
	<artifactId>spring-boot-starter-data-mongodb-reactive</artifactId>
</dependency>

The support for reactive Mongo repositories is automatically enabled after including the starter. The next step is to declare entity with ORM mappings. The following class is also returned as reponse by AccountController.

@Document
public class Account {

	@Id
	private String id;
	private String number;
	private String customerId;
	private int amount;

	...

}

Finally, we may create repository interface that extends ReactiveCrudRepository. It follows the patterns implemented by Spring Data JPA and provides some basic methods for CRUD operations. It also allows to define methods with names, which are automatically mapped to queries. The only difference in comparison with standard Spring Data JPA repositories is in method signatures. The objects are wrapped by Mono and Flux.

public interface AccountRepository extends ReactiveCrudRepository {

	Flux findByCustomerId(String customerId);

}

In this example I used Docker container for running MongoDB locally. Because I run Docker on Windows using Docker Toolkit the default address of Docker machine is 192.168.99.100. Here’s the configuration of data source in application.yml file.

spring:
  data:
    mongodb:
      uri: mongodb://192.168.99.100/test

Step 3. Enabling service discovery using Eureka

Integration with Spring Cloud Eureka is pretty the same as for synchronous REST microservices. To enable discovery client we should first include starter spring-cloud-starter-netflix-eureka-client to the project dependencies.

<dependency>
	<groupId>org.springframework.cloud</groupId>
	<artifactId>spring-cloud-starter-netflix-eureka-client</artifactId>
</dependency>

Then we have to enable it using @EnableDiscoveryClient annotation.

@SpringBootApplication
@EnableDiscoveryClient
public class AccountApplication {

	public static void main(String[] args) {
		SpringApplication.run(AccountApplication.class, args);
	}

}

Microservice will automatically register itself in Eureka. Of cource, we may run more than instance of every service. Here’s the screen illustrating Eureka Dashboard (http://localhost:8761) after running two instances of account-service and a single instance of customer-service.  I would not like to go into the details of running application with embedded Eureka server. You may refer to my previous article for details: Quick Guide to Microservices with Spring Boot 2.0, Eureka and Spring Cloud. Eureka server is available as discovery-service module.

spring-reactive

Step 4. Inter-service communication between reactive microservices with WebClient

An inter-service communication is realized by the WebClient from Spring WebFlux project. The same as for RestTemplate you should annotate it with Spring Cloud Commons @LoadBalanced . It enables integration with service discovery and load balancing using Netflix OSS Ribbon client. So, the first step is to declare a client builder bean with @LoadBalanced annotation.

@Bean
@LoadBalanced
public WebClient.Builder loadBalancedWebClientBuilder() {
	return WebClient.builder();
}

Then we may inject WebClientBuilder into the REST controller. Communication with account-service is implemented inside GET /{id}/with-accounts , where first we are searching for customer entity using reactive Spring Data repository. It returns object Mono , while the WebClient returns Flux . Now, our main goal is to merge those to publishers and return single Mono object with the list of accounts taken from Flux without blocking the stream. The following fragment of code illustrates how I used WebClient to communicate with other microservice, and then merge the response and result from repository to single Mono object. This merge may probably be done in more “ellegant” way, so fell free to create push request with your proposal.

@Autowired
private WebClient.Builder webClientBuilder;

@GetMapping("/{id}/with-accounts")
public Mono findByIdWithAccounts(@PathVariable("id") String id) {
	LOGGER.info("findByIdWithAccounts: id={}", id);
	Flux accounts = webClientBuilder.build().get().uri("http://account-service/customer/{customer}", id).retrieve().bodyToFlux(Account.class);
	return accounts
			.collectList()
			.map(a -> new Customer(a))
			.mergeWith(repository.findById(id))
			.collectList()
			.map(CustomerMapper::map);
}

Step 5. Building API gateway using Spring Cloud Gateway

Spring Cloud Gateway is one of the newest Spring Cloud project. It is built on top of Spring WebFlux, and thanks to that we may use it as a gateway to our sample system based on reactive microservices. Similar to Spring WebFlux applications it is ran on embedded Netty server. To enable it for Spring Boot application just include the following dependency to your project.

<dependency>
	<groupId>org.springframework.cloud</groupId>
	<artifactId>spring-cloud-starter-gateway</artifactId>
</dependency>

We should also enable discovery client in order to allow the gateway to fetch list of registered microservices. However, there is no need to register gateway’s application in Eureka. To disable registration you may set property eureka.client.registerWithEureka to false inside application.yml file.

@SpringBootApplication
@EnableDiscoveryClient
public class GatewayApplication {

	public static void main(String[] args) {
		SpringApplication.run(GatewayApplication.class, args);
	}

}

By default, Spring Cloud Gateway does not enable integration with service discovery. To enable it we should set property spring.cloud.gateway.discovery.locator.enabled to true. Now, the last thing that should be done is the configuration of the routes. Spring Cloud Gateway provides two types of components that may be configured inside routes: filters and predicates. Predicates are used for matching HTTP requests with route, while filters can be used to modify requests and responses before or after sending the downstream request. Here’s the full configuration of gateway. It enables service discovery location, and defines two routes based on entries in service registry. We use the Path Route Predicate factory for matching the incoming requests, and the RewritePath GatewayFilter factory for modifying the requested path to adapt it to the format exposed by the downstream services (endpoints are exposed under path /, while gateway expose them under paths /account and /customer).

spring:
  cloud:
    gateway:
      discovery:
        locator:
          enabled: true
      routes:
      - id: account-service
        uri: lb://account-service
        predicates:
        - Path=/account/**
        filters:
        - RewritePath=/account/(?.*), /$\{path}
      - id: customer-service
        uri: lb://customer-service
        predicates:
        - Path=/customer/**
        filters:
        - RewritePath=/customer/(?.*), /$\{path}

Step 6. Testing the sample system

Before making some tests let’s just recap our sample system. We have two microservices account-service, customer-service that use MongoDB as a database. Microservice customer-service calls endpoint GET /customer/{customer} exposed by account-service. URL of account-service is taken from Eureka. The whole sample system is hidden behind gateway, which is available under address localhost:8090.
Now, the first step is to run MongoDB on Docker container. After executing the following command Mongo is available under address 192.168.99.100:27017.

$ docker run -d --name mongo -p 27017:27017 mongo

Then we may proceeed to running discovery-service. Eureka is available under its default address localhost:8761. You may run it using your IDE or just by executing command java -jar target/discovery-service-1.0-SNAPHOT.jar. The same rule applies to our sample microservices. However, account-service needs to be multiplied in two instances, so you need to override default HTTP port when running second instance using -Dserver.port VM argument, for example java -jar -Dserver.port=2223 target/account-service-1.0-SNAPSHOT.jar. Finally, after running gateway-service we may add some test data.

$ curl --header "Content-Type: application/json" --request POST --data '{"firstName": "John","lastName": "Scott","age": 30}' http://localhost:8090/customer
{"id": "5aec1debfa656c0b38b952b4","firstName": "John","lastName": "Scott","age": 30,"accounts": null}
$ curl --header "Content-Type: application/json" --request POST --data '{"number": "1234567890","amount": 5000,"customerId": "5aec1debfa656c0b38b952b4"}' http://localhost:8090/account
{"id": "5aec1e86fa656c11d4c655fb","number": "1234567892","customerId": "5aec1debfa656c0b38b952b4","amount": 5000}
$ curl --header "Content-Type: application/json" --request POST --data '{"number": "1234567891","amount": 12000,"customerId": "5aec1debfa656c0b38b952b4"}' http://localhost:8090/account
{"id": "5aec1e91fa656c11d4c655fc","number": "1234567892","customerId": "5aec1debfa656c0b38b952b4","amount": 12000}
$ curl --header "Content-Type: application/json" --request POST --data '{"number": "1234567892","amount": 2000,"customerId": "5aec1debfa656c0b38b952b4"}' http://localhost:8090/account
{"id": "5aec1e99fa656c11d4c655fd","number": "1234567892","customerId": "5aec1debfa656c0b38b952b4","amount": 2000}

To test inter-service communication just call endpoint GET /customer/{id}/with-accounts on gateway-service. It forward the request to customer-service, and then customer-service calls enpoint exposed by account-service using reactive WebClient. The result is visible below.

reactive-2

Conclusion

Since Spring 5 and Spring Boot 2.0 there is a full range of available ways to build microservices-based architecture. We can build standard synchronous system using one-to-one communication with Spring Cloud Netflix project, messaging microservices based on message broker and publish/subscribe communication model with Spring Cloud Stream, and finally asynchronous, reactive microservices with Spring WebFlux. The main goal of this article is to show you how to use Spring WebFlux together with Spring Cloud projects in order to provide such a mechanisms like service discovery, load balancing or API gateway for reactive microservices build on top of Spring Boot. Before Spring 5 the lack of support for reactive microservices was one of the drawback of Spring framework, but now with Spring WebFlux it is no longer the case. Not only that, we may leverage Spring reactive support for the most popular NoSQL databases like MongoDB or Cassandra, and easily place our reactive microservices inside one system together with synchronous REST microservices.