Have you ever tried to run any message broker on Kubernetes? KubeMQ is relatively new solution and is not as popular as competitive tools like RabbitMQ, Kafka or ActiveMQ. However, it has one big advantage over them – it is Kubernetes native message broker, which may be deployed there using a single command without preparing any additional templates or manifests. This convinced me to take a closer look at KubeMQ. Continue reading “Kubernetes Messaging with Java and KubeMQ”
Category: Message Brokers
Kafka In Microservices With Micronaut
Posted on by Piotr Mińkowski
Today we are going to build some microservices communicating with each other asynchronously through Apache Kafka topics. We use Micronaut Framework, which provides dedicated library for integration with Kafka. Let’s take a brief look at the architecture of our sample system. We have 4 microservices: order-service, trip-service, driver-service and passenger-service. The implementation of these applications is very simple. All of them have in-memory storage and connect to the same Kafka instance.
Continue reading “Kafka In Microservices With Micronaut” →
Redis in Microservices Architecture
Posted on by Piotr Mińkowski
Redis can be widely used in microservices architecture. It is probably one of the few popular software solutions that may be leveraged by your application in such many different ways. Depending on the requirements it can acts as a primary database, cache, message broker. While it is also a key/value store we can use it as a configuration server or discovery server in your microservices architecture. Although it is usually defined as an in-memory data structure, we can also run it in persistent mode.
Today, I’m going to show you some examples of using Redis with microservices built on top of Spring Boot and Spring Cloud frameworks. These application will communicate between each other asynchronously using Redis Pub/Sub, using Redis as a cache or primary database, and finally used Redis as a configuration server. Continue reading “Redis in Microservices Architecture” →

RabbitMQ Cluster with Consul and Vault
Posted on by Piotr Mińkowski
Almost two years ago I wrote an article about RabbitMQ clustering RabbitMQ in cluster. It was one of the first post on my blog, and it’s really hard to believe it has been two years since I started this blog. Anyway, one of the question about the topic described in the mentioned article inspired me to return to that subject one more time. That question pointed to the problem of an approach to setting up the cluster. This approach assumes that we are manually attaching new nodes to the cluster by executing the command rabbitmqctl join_cluster with cluster name as a parameter. If I remember correctly it was the only one available method of creating cluster at that time. Today we have more choices, what illustrates an evolution of RabbitMQ during last two years. Continue reading “RabbitMQ Cluster with Consul and Vault” →
Building and testing message-driven microservices using Spring Cloud Stream
Posted on by Piotr Mińkowski
Spring Boot and Spring Cloud give you a great opportunity to build microservices fast using different styles of communication. You can create synchronous REST microservices based on Spring Cloud Netflix libraries as shown in one of my previous articles Quick Guide to Microservices with Spring Boot 2.0, Eureka and Spring Cloud. You can create asynchronous, reactive microservices deployed on Netty with Spring WebFlux project and combine it succesfully with some Spring Cloud libraries as shown in my article Reactive Microservices with Spring WebFlux and Spring Cloud. And finally, you may implement message-driven microservices based on publish/subscribe model using Spring Cloud Stream and message broker like Apache Kafka or RabbitMQ. The last of listed approaches to building microservices is the main subject of this article. I’m going to show you how to effectively build, scale, run and test messaging microservices basing on RabbitMQ broker.
Architecture
For the purpose of demonstrating Spring Cloud Stream features we will design a sample system which uses publish/subscribe model for inter-service communication. We have three microservices: order-service, product-service and account-service. Application order-service exposes HTTP endpoint that is responsible for processing orders sent to our system. All the incoming orders are processed asynchronously – order-service prepare and send message to RabbitMQ exchange and then respond to the calling client that the request has been accepted for processing. Applications account-service and product-service are listening for the order messages incoming to the exchange. Microservice account-service is responsible for checking if there are sufficient funds on customer’s account for order realization and then withdrawing cash from this account. Microservice product-service checks if there is sufficient amount of products in the store, and changes the number of available products after processing order. Both account-service and product-service send asynchronous response through RabbitMQ exchange (this time it is one-to-one communication using direct exchange) with a status of operation. Microservice order-service after receiving response messages sets the appropriate status of the order and exposes it through REST endpoint GET /order/{id} to the external client.
If you feel that the description of our sample system is a little incomprehensible, here’s the diagram with architecture for clarification.

Enabling Spring Cloud Stream
The recommended way to include Spring Cloud Stream in the project is with a dependency management system. Spring Cloud Stream has an independent release trains management in relation to the whole Spring Cloud framework. However, if we have declared spring-cloud-dependencies in the Elmhurst.RELEASE version inside the dependencyManagement
section, we wouldn’t have to declare anything else in pom.xml. If you prefer to use only the Spring Cloud Stream project, you should define the following section.
<dependencyManagement>
  <dependencies>
    <dependency>
      <groupId>org.springframework.cloud</groupId>
      <artifactId>spring-cloud-stream-dependencies</artifactId>
      <version>Elmhurst.RELEASE</version>
      <type>pom</type>
      <scope>import</scope>
    </dependency>
  </dependencies>
</dependencyManagement>
The next step is to add spring-cloud-stream artifact to the project dependencies. I also recommend you include at least the spring-cloud-sleuth library to provide sending messaging with the same traceId as the source request incoming to order-service.
<dependency>
  <groupId>org.springframework.cloud</groupId>
  <artifactId>spring-cloud-stream</artifactId>
</dependency>
<dependency>
  <groupId>org.springframework.cloud</groupId>
  <artifactId>spring-cloud-sleuth</artifactId>
</dependency>
Spring Cloud Stream programming model
To enable connectivity to a message broker for your application, annotate the main class with @EnableBinding. The @EnableBinding annotation takes one or more interfaces as parameters. You may choose between three interfaces provided by Spring Cloud Stream:
- Sink: This is used for marking a service that receives messages from the inbound channel.
- Source: This is used for sending messages to the outbound channel.
- Processor: This can be used in case you need both an inbound channel and an outbound channel, as it extends the Source and Sink interfaces. Because
order-servicesends messages, as well as receives them, its main class has been annotated with@EnableBinding(Processor.class).
Here’s the main class of order-service that enables Spring Cloud Stream binding.
@SpringBootApplication
@EnableBinding(Processor.class)
public class OrderApplication {
  public static void main(String[] args) {
    new SpringApplicationBuilder(OrderApplication.class).web(true).run(args);
  }
}
Adding message broker
In Spring Cloud Stream nomenclature the implementation responsible for integration with specific message broker is called binder. By default, Spring Cloud Stream provides binder implementations for Kafka and RabbitMQ. It is able to automatically detect and use a binder found on the classpath. Any middleware-specific settings can be overridden through external configuration properties in the form supported by Spring Boot, such as application arguments, environment variables, or just the application.yml file. To include support for RabbitMQ, which used it this article as a message broker, you should add the following dependency to the project.
<dependency>
  <groupId>org.springframework.cloud</groupId>
  <artifactId>spring-cloud-starter-stream-rabbit</artifactId>
</dependency>
Now, our applications need to connected with one, shared instance of RabbitMQ broker. That’s why I run Docker image with RabbitMQ exposed outside on default 5672 port. It also launches web dashboard available under address http://192.168.99.100:15672.
$ docker run -d --name rabbit -p 15672:15672 -p 5672:5672 rabbitmq:management
We need to override default address of RabbitMQ for every Spring Boot application by settings property spring.rabbitmq.host to Docker machine IP 192.168.99.100.
spring:
  rabbitmq:
    host: 192.168.99.100
    port: 5672
Implementing message-driven microservices
Spring Cloud Stream is built on top of Spring Integration project. Spring Integration extends the Spring programming model to support the well-known Enterprise Integration Patterns (EIP). EIP defines a number of components that are typically used for orchestration in distributed systems. You have probably heard about patterns such as message channels, routers, aggregators, or endpoints. Let’s proceed to the implementation.
We begin from order-service, that is responsible for accepting orders, publishing them on shared topic and then collecting asynchronous responses from downstream services. Here’s the @Service, which builds message and publishes it to the remote topic using Source bean.
@Service
public class OrderSender {
  @Autowired
  private Source source;

  public boolean send(Order order) {
    return this.source.output().send(MessageBuilder.withPayload(order).build());
  }
}
That @Service is called by the controller, which exposes the HTTP endpoints for submitting new orders and getting order with status by id.
@RestController
public class OrderController {

	private static final Logger LOGGER = LoggerFactory.getLogger(OrderController.class);

	private ObjectMapper mapper = new ObjectMapper();

	@Autowired
	OrderRepository repository;
	@Autowired
	OrderSender sender;

	@PostMapping
	public Order process(@RequestBody Order order) throws JsonProcessingException {
		Order o = repository.add(order);
		LOGGER.info("Order saved: {}", mapper.writeValueAsString(order));
		boolean isSent = sender.send(o);
		LOGGER.info("Order sent: {}", mapper.writeValueAsString(Collections.singletonMap("isSent", isSent)));
		return o;
	}

	@GetMapping("/{id}")
	public Order findById(@PathVariable("id") Long id) {
		return repository.findById(id);
	}

}
Now, let’s take a closer look on consumer side. The message sent by OrderSender bean from order-service is received by account-service and product-service. To receive the message from topic exchange, we just have to annotate the method that takes the Order object as a parameter with @StreamListener. We also have to define target channel for listener – in that case it is Processor.INPUT.
@SpringBootApplication
@EnableBinding(Processor.class)
public class OrderApplication {

	private static final Logger LOGGER = LoggerFactory.getLogger(OrderApplication.class);

	@Autowired
	OrderService service;

	public static void main(String[] args) {
		new SpringApplicationBuilder(OrderApplication.class).web(true).run(args);
	}

	@StreamListener(Processor.INPUT)
	public void receiveOrder(Order order) throws JsonProcessingException {
		LOGGER.info("Order received: {}", mapper.writeValueAsString(order));
		service.process(order);
	}

}
Received order is then processed by AccountService bean. Order may be accepted or rejected by account-service dependending on sufficient funds on customer’s account for order’s realization. The response with acceptance status is sent back to order-service via output channel invoked by the OrderSender bean.
@Service
public class AccountService {

	private static final Logger LOGGER = LoggerFactory.getLogger(AccountService.class);

	private ObjectMapper mapper = new ObjectMapper();

	@Autowired
	AccountRepository accountRepository;
	@Autowired
	OrderSender orderSender;

	public void process(final Order order) throws JsonProcessingException {
		LOGGER.info("Order processed: {}", mapper.writeValueAsString(order));
		List accounts =  accountRepository.findByCustomer(order.getCustomerId());
		Account account = accounts.get(0);
		LOGGER.info("Account found: {}", mapper.writeValueAsString(account));
		if (order.getPrice() <= account.getBalance()) {
			order.setStatus(OrderStatus.ACCEPTED);
			account.setBalance(account.getBalance() - order.getPrice());
		} else {
			order.setStatus(OrderStatus.REJECTED);
		}
		orderSender.send(order);
		LOGGER.info("Order response sent: {}", mapper.writeValueAsString(order));
	}

}
The last step is configuration. It is provided inside application.yml file. We have to properly define destinations for channels. While order-service is assigning orders-out destination to output channel, and orders-in destination to input channel, account-service and product-service do the opposite. It is logical, because message sent by order-service via its output destination is received by consuming services via their input destinations. But it is still the same destination on shared broker’s exchange. Here are configuration settings of order-service.
spring:
  cloud:
    stream:
      bindings:
        output:
          destination: orders-out
        input:
          destination: orders-in
      rabbit:
        bindings:
          input:
            consumer:
              exchangeType: direct
Here’s configuration provided for account-service and product-service.
spring:
  cloud:
    stream:
      bindings:
        output:
          destination: orders-in
        input:
          destination: orders-out
      rabbit:
        bindings:
          output:
            producer:
              exchangeType: direct
              routingKeyExpression: '"#"'
Finally, you can run our sample microservice. For now, we just need to run a single instance of each microservice. You can easily generate some test requests by running JUnit test class OrderControllerTest provided in my source code repository inside module order-service. This case is simple. In the next we will study more advanced sample with multiple running instances of consuming services.
Scaling up
To scale up our Spring Cloud Stream applications we just need to launch additional instances of each microservice. They will still listen for the incoming messages on the same topic exchange as the currently running instances. After adding one instance of account-service and product-service we may send a test order. The result of that test won’t be satisfactory for us… Why? A single order is received by all the running instances of every microservice. This is exactly how topic exchanges works – the message sent to topic is received by all consumers, which are listening on that topic. Fortunately, Spring Cloud Stream is able to solve that problem by providing solution called consumer group. It is responsible for guarantee that only one of the instances is expected to handle a given message, if they are placed in a competing consumer relationship. The transformation to consumer group mechanism when running multiple instances of the service has been visualized on the following figure.

Configuration of a consumer group mechanism is not very difficult. We just have to set group parameter with name of the group for given destination. Here’s the current binding configuration for account-service. The orders-in destination is a queue created for direct communication with order-service, so only orders-out is grouped using spring.cloud.stream.bindings..group property.
spring:
  cloud:
    stream:
      bindings:
        output:
          destination: orders-in
        input:
          destination: orders-out
          group: account
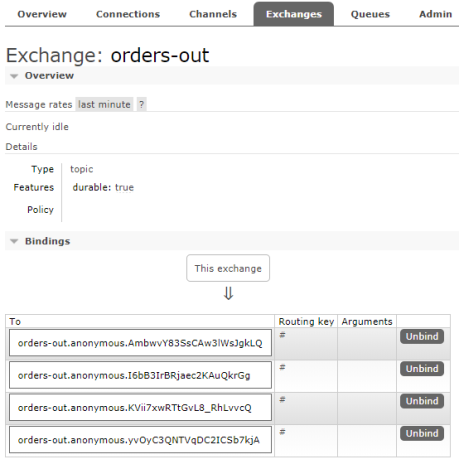
Consumer group mechanisms is a concept taken from Apache Kafka, and implemented in Spring Cloud Stream also for RabbitMQ broker, which does not natively support it. So, I think it is pretty interesting how it is configured on RabbitMQ. If you run two instances of the service without setting group name on destination there are two bindings created for a single exchange (one binding per one instance) as shown in the picture below. Because two applications are listening on that exchange, there four bindings assigned to that exchange in total.
If you set group name for selected destination Spring Cloud Stream will create a single binding for all running instances of given service. The name of binding will be suffixed with group name.

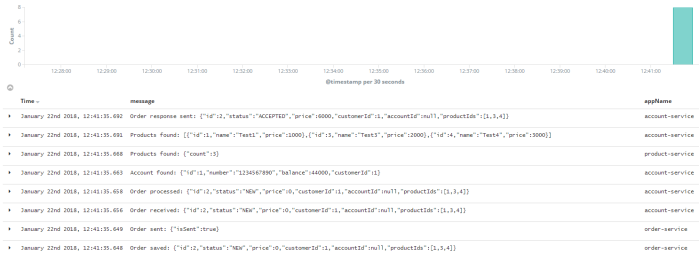
Because, we have included spring-cloud-starter-sleuth to the project dependencies the same traceId header is sent between all the asynchronous requests exchanged during realization of single request incoming to the order-service POST endpoint. Thanks to that we can easily correlate all logs using this header using Elastic Stack (Kibana).
Automated Testing
You can easily test your microservice without connecting to a message broker. To achieve it you need to include spring-cloud-stream-test-support to your project dependencies. It contains the TestSupportBinder bean that lets you interact with the bound channels and inspect any messages sent and received by the application.
<dependency>
  <groupId>org.springframework.cloud</groupId>
  <artifactId>spring-cloud-stream-test-support</artifactId>
  <scope>test</scope>
</dependency>
In the test class we need to declare MessageCollector bean, which is responsible for receiving messages retained by TestSupportBinder. Here’s my test class from account-service. Using Processor bean I send test order to input channel. Then MessageCollector receives message that is sent back to order-service via output channel. Test method testAccepted creates order that should be accepted by account-service, while testRejected method sets too high order price that results in rejecting the order.
@RunWith(SpringRunner.class)
@SpringBootTest(webEnvironment = SpringBootTest.WebEnvironment.RANDOM_PORT)
public class OrderReceiverTest {

	private static final Logger LOGGER = LoggerFactory.getLogger(OrderReceiverTest.class);

	@Autowired
	private Processor processor;
	@Autowired
	private MessageCollector messageCollector;

	@Test
	@SuppressWarnings("unchecked")
	public void testAccepted() {
		Order o = new Order();
		o.setId(1L);
		o.setAccountId(1L);
		o.setCustomerId(1L);
		o.setPrice(500);
		o.setProductIds(Collections.singletonList(2L));
		processor.input().send(MessageBuilder.withPayload(o).build());
		Message received = (Message) messageCollector.forChannel(processor.output()).poll();
		LOGGER.info("Order response received: {}", received.getPayload());
		assertNotNull(received.getPayload());
		assertEquals(OrderStatus.ACCEPTED, received.getPayload().getStatus());
	}

	@Test
	@SuppressWarnings("unchecked")
	public void testRejected() {
		Order o = new Order();
		o.setId(1L);
		o.setAccountId(1L);
		o.setCustomerId(1L);
		o.setPrice(100000);
		o.setProductIds(Collections.singletonList(2L));
		processor.input().send(MessageBuilder.withPayload(o).build());
		Message received = (Message) messageCollector.forChannel(processor.output()).poll();
		LOGGER.info("Order response received: {}", received.getPayload());
		assertNotNull(received.getPayload());
		assertEquals(OrderStatus.REJECTED, received.getPayload().getStatus());
	}

}
Conclusion
Message-driven microservices are a good choice whenever you don’t need synchronous response from your API. In this article I have shown sample use case of publish/subscribe model in inter-service communication between your microservices. The source code is as usual available on GitHub (https://github.com/piomin/sample-message-driven-microservices.git). For more interesting examples with usage of Spring Cloud Stream library, also with Apache Kafka, you can refer to Chapter 11 in my book Mastering Spring Cloud (https://www.packtpub.com/application-development/mastering-spring-cloud).
Partitioning with Apache Kafka and Vert.x
Posted on by Piotr Mińkowski
Apache Kafka is a distributed streaming platform. It also may act as a messaging system in your architecture. Traditional message brokers provides two models of communication: queuing and publish-subscribe (topics). Queues are used for point-to-point messaging, while topics allows you broadcast data to multiple target consumers. Kafka does not provide queuing mechanism directly. However, it introduces the consumer group concept, which generalizes both queuing and publish-subscribe models. The consumer group mechanisms guarantees that a single message would be processed by the only one consumer that belongs to the given group. It is especially useful when you have more than one instance of your service, which listens for messages incoming to the topic. That feature makes your consumers to behave as queuing clients within the same group.
Eclipse Vert.x is a lightweight and fast toolkit for building reactive applications on the JVM. I have already introduced that solution is the some of my previous posts, for example Asynchronous Microservices with Vert.x. Vert.x does not force you to implement a reactive application. You may create a standard service, which processes the HTTP requests asynchronously in accordance with Asynchronous I/O concept.
The purpose of this article
The main purpose of this article is to show you the main features of Apache Kafka, that may be useful when creating applications consuming messages. The Java client’s library choice is not a key point here. However, in my opinion Vert.x that is asynchronous, high performance framework perfectly matches to Apache Kafka. It provides Vert.x Kafka client, which allows you to read and send messages from/to an Kafka cluster. Before we proceed to the sample, let’s first dive into the core abstraction of Kafka.
Kafka topic
I’m assuming you excellent know what topic is and what is its main role. The every message incoming to the topic goes to every subscriber. What is the main difference between Kafka and standard topic provided by other message brokers? Kafka topic is partitioned. Each partition is an ordered, immutable sequence of records. Every record can be uniquecly identified within the partition by a sequential id number called the offset. The Kafka cluster retains all published records according to the configured retention period.
Consumer may subscribe to the whole topic or only to the selected partition. It can also control the offset from where it starts processing data. For example, it is able to reset offset in order reprocess data from the past or just or skip ahead to the most recent record to consume only messages currently sent to the topic. Here’s the figure that illustrates a single partition structure with producer and consumers listening for the incoming data.

Sample architecture
Let me say some words about the sample system architecture. Its source code is available on GitHub (https://github.com/piomin/sample-vertx-kafka-messaging.git). In accordance of the principle that one picture speaks more than a thousand words, the diagram illustrating the architecture of our system is visible below. We have one topic created on Kafka platform, that consists of two partitions. There is one client application that exposes REST API allowing to send orders into the system and then forwarding them into the topic. The target partition is calculated basing on the type of order. We may create orders with types SINGLE and MULTIPLE. There are also some applications that consumes data from topic. First of them single-order-processor reads data from partition 0, the second multiple-order-processor from partition 1, and the last all-order-processor does not choose any partition.

Running Kafka
To run Apache Kafka on the local machine we may use its Docker image. The image shared by Spotify also starts ZooKeeper server, which is used by Kafka. If you run Docker on Windows the default address of its virtual machine is 192.168.99.100.
docker run -d --name kafka -p 2181:2181 -p 9092:9092 --env ADVERTISED_HOST=192.168.99.100 --env ADVERTISED_PORT=9092 spotify/kafka
However, that option assumes the topics would be automatically created during application startup. I’ve got some problems with it while creating multi-partitions topic. There is also another image ches/kafka, which requires starting ZooKeeper separately, but provides Kafka client interface.
docker run -d --name zookeeper -p 2181:2181 zookeeper
docker run -d --name kafka -p 9092:9092 -p 7203:7203 --network kafka-net --env KAFKA_ADVERTISED_HOST_NAME=192.168.99.100 --env ZOOKEEPER_IP=192.168.99.100 ches/kafka
Finally, we can run ches/kafka container in client mode and then create topic orders-out with two partitions.
docker run --rm --network kafka-net ches/kafka kafka-topics.sh --create --topic orders-out --replication-factor 1 --partitions 2 --zookeeper 192.168.99.100:2181
Created topic "orders-out".
Building producer application
First, we need to include Maven dependencies to enable Vert.x framework for the application. If the application exposes RESTful HTTP API you should include vertx-web. Library vertx-kafka-client has to be included to all the sample modules.
To start Vert.x as Java application we have to create verticle by extending AbstractVerticle. Then the verticle needs to be deployed in the main method using Vertx object. For more details about Vert.x and verticles concept you may refer to one of my previous article mentioned in the preface.
public class OrderVerticle extends AbstractVerticle {

	public static void main(String[] args) {
		Vertx vertx = Vertx.vertx();
		vertx.deployVerticle(new OrderVerticle());
	}

}
The next step is to define producer using KafkaProducer interface. We have to provide connection settings and serializer implementation class. You can choose between various built-in serializer implemementations. The most suitable for me was JsonObjectSerializer, which requires JsonObject as an input parameter.
Properties config = new Properties();
config.put(ProducerConfig.BOOTSTRAP_SERVERS_CONFIG, "192.168.99.100:9092");
config.put(ProducerConfig.KEY_SERIALIZER_CLASS_CONFIG, StringSerializer.class);
config.put(ProducerConfig.VALUE_SERIALIZER_CLASS_CONFIG, JsonObjectSerializer.class);
config.put(ProducerConfig.ACKS_CONFIG, "1");
KafkaProducer producer = KafkaProducer.create(vertx, config);
The procuder is invoked inside POST method route definition. It returnes an asynchronous response with a status after sending message to the topic. The message is created using KafkaProducerRecord interface. It takes topic’s name, request object and partition number as the parameters. As you may see in the fragment of code below, partition number is calculated on the basis order type (o.getType().ordinal()).
Router router = Router.router(vertx);
router.route("/order/*").handler(ResponseContentTypeHandler.create());
router.route(HttpMethod.POST, "/order").handler(BodyHandler.create());
router.post("/order").produces("application/json").handler(rc -> {
	Order o = Json.decodeValue(rc.getBodyAsString(), Order.class);
	KafkaProducerRecord record = KafkaProducerRecord.create("orders", null, rc.getBodyAsJson(), o.getType().ordinal());
	producer.write(record, done -> {
		if (done.succeeded()) {
			RecordMetadata recordMetadata = done.result();
			LOGGER.info("Record sent: msg={}, destination={}, partition={}, offset={}", record.value(), recordMetadata.getTopic(), recordMetadata.getPartition(), recordMetadata.getOffset());
			o.setId(recordMetadata.getOffset());
			o.setStatus(OrderStatus.PROCESSING);
		} else {
			Throwable t = done.cause();
			LOGGER.error("Error sent to topic: {}", t.getMessage());
			o.setStatus(OrderStatus.REJECTED);
		}
		rc.response().end(Json.encodePrettily(o));
	});
});
vertx.createHttpServer().requestHandler(router::accept).listen(8090);
Building consumer applications
The consumer configuration is very similar to that for producer. We also have to set connection settings and class using for deserialization. There is one interesting setting, which has been defined for the consumer in the fragment of code visible below. It is auto.offset.reset (ConsumerConfig.AUTO_OFFSET_RESET_CONFIG). It sets the initial offset in Kafka for the customer during initialization. If you would like to read all records from the beginning of stream use value earliest. If you would like to processes only the newest records (received after application startup) set that property to latest. Because in our case Kafka acts as a message broker, it is set to latest.
Properties config = new Properties();
config.put(ConsumerConfig.BOOTSTRAP_SERVERS_CONFIG, "192.168.99.100:9092");
config.put(ConsumerConfig.KEY_DESERIALIZER_CLASS_CONFIG, StringDeserializer.class);
config.put(ConsumerConfig.VALUE_DESERIALIZER_CLASS_CONFIG, StringDeserializer.class);
config.put(ConsumerConfig.AUTO_OFFSET_RESET_CONFIG, "latest");
config.put(ConsumerConfig.ENABLE_AUTO_COMMIT_CONFIG, "false");
KafkaConsumer consumer = KafkaConsumer.create(vertx, config);
As you probably remember we have three different application that subscribe to the topic. The first of them, implemented under the module all-order-processor consumes all the events incoming to the the topic. This implemementation is relatively the simplest. We only need to invoke subscribe method and pass the name of topic as a parameter. Then every incoming message is processed by handler method.
consumer.subscribe("orders-out", ar -> {
	if (ar.succeeded()) {
		LOGGER.info("Subscribed");
	} else {
		LOGGER.error("Could not subscribe: err={}", ar.cause().getMessage());
	}
});

consumer.handler(record -> {
	LOGGER.info("Processing: key={}, value={}, partition={}, offset={}", record.key(), record.value(), record.partition(), record.offset());
	Order order = Json.decodeValue(record.value(), Order.class);
	order.setStatus(OrderStatus.DONE);
	LOGGER.info("Order processed: id={}, price={}", order.getId(), order.getPrice());
});
The implementation of consuming method for the other applications is a little more complicated. Besides defining target topic, every consumer can ask for a specific partition. The application multiple-order-processor subscribes to partition 1, while multiple-order-processor to partition 0.
TopicPartition tp = new TopicPartition().setPartition(1).setTopic("orders-out");
consumer.assign(tp, ar -> {
	if (ar.succeeded()) {
		LOGGER.info("Subscribed");
		consumer.assignment(done1 -> {
			if (done1.succeeded()) {
				for (TopicPartition topicPartition : done1.result()) {
					LOGGER.info("Partition: topic={}, number={}", topicPartition.getTopic(), topicPartition.getPartition());
				}
			} else {
				LOGGER.error("Could not assign partition: err={}", done1.cause().getMessage());
			}
		});
	} else {
		LOGGER.error("Could not subscribe: err={}", ar.cause().getMessage());
	}
});
The implamentation of handle method inside multiple-order-processor is pretty interesting. If it receives order with non-empty field relatedOrderId it tries to find it in the historical records stored in topic. It may achieved by calling seek method on KafkaConsumer.
consumer.handler(record -> {
	LOGGER.info("Processing: key={}, value={}, partition={}, offset={}", record.key(), record.value(), record.partition(), record.offset());
	Order order = Json.decodeValue(record.value(), Order.class);
	if (ordersWaiting.containsKey(record.offset())) {
		LOGGER.info("Related order found: id={}, price={}", order.getId(), order.getPrice());
		LOGGER.info("Current price: price={}", order.getPrice() + ordersWaiting.get(record.offset()).getPrice());
		consumer.seekToEnd(tp);
	}

	if (order.getRelatedOrderId() != null && !ordersWaiting.containsKey(order.getRelatedOrderId())) {
		ordersWaiting.put(order.getRelatedOrderId(), order);
		consumer.seek(tp, order.getRelatedOrderId());
	}
});
Testing
Now it is time to launch our applications. You may run the main classes from your IDE or build the whole project using mvn clean install command and then run it with java -jar. Also run two instances of all-order-processor in order to check out how a consumer groups mechanism works in practice.
Let’s send some test requests to the order-service in the following sequence.
curl -H "Content-Type: application/json" -X POST -d '{"type":"SINGLE","status":"NEW","price":200}' http://localhost:8090/order
{"id":0,"type":"SINGLE","status":"PROCESSING","price":200}
curl -H "Content-Type: application/json" -X POST -d '{"type":"SINGLE","status":"NEW","price":300}' http://localhost:8090/order
{"id":1,"type":"SINGLE","status":"PROCESSING","price":300}
curl -H "Content-Type: application/json" -X POST -d '{"type":"MULTIPLE","status":"NEW","price":400}' http://localhost:8090/order
{"id":0,"type":"MULTIPLE","status":"PROCESSING","price":400}
curl -H "Content-Type: application/json" -X POST -d '{"type":"MULTIPLE","status":"NEW","price":500,"relatedOrderId" :0}' http://localhost:8090/order
{"id":1,"type":"MULTIPLE","status":"PROCESSING","price":500}
Here’s log from producer application.
2018-01-30 11:08:48 [INFO ]  Record sent: msg={"type":"SINGLE","status":"NEW","price":200}, destination=orders-out, partition=0, offset=0
2018-01-30 11:08:57 [INFO ]  Record sent: msg={"type":"SINGLE","status":"NEW","price":300}, destination=orders-out, partition=0, offset=1
2018-01-30 11:09:08 [INFO ]  Record sent: msg={"type":"MULTIPLE","status":"NEW","price":400}, destination=orders-out, partition=1, offset=0
2018-01-30 11:09:27 [INFO ]  Record sent: msg={"type":"MULTIPLE","status":"NEW","price":500,"relatedOrderId":0}, destination=orders-out, partition=1, offset=1
Here’s log from single-order-processor. It has processed only messages from partition 0.
2018-01-30 11:08:48 [INFO ]  Processing: key=null, value={"type":"SINGLE","status":"NEW","price":200}, partition=0, offset=0
2018-01-30 11:08:57 [INFO ]  Processing: key=null, value={"type":"SINGLE","status":"NEW","price":300}, partition=0, offset=1
Here’s log from multiple-order-processor. It has processed only messages from partition 1.
2018-01-30 11:09:08 [INFO ]  Processing: key=null, value={"type":"MULTIPLE","status":"NEW","price":400}, partition=1, offset=0
2018-01-30 11:09:27 [INFO ]  Processing: key=null, value={"type":"MULTIPLE","status":"NEW","price":500,"relatedOrderId":0}, partition=1, offset=1
Here’s log from first instance of all-order-processor.
2018-01-30 11:08:48 [INFO ]  Processing: key=null, value={"type":"SINGLE","status":"NEW","price":200}, partition=0, offset=0
2018-01-30 11:08:57 [INFO ]  Processing: key=null, value={"type":"SINGLE","status":"NEW","price":300}, partition=0, offset=1
Here’s log from second instance of all-order-processor. It may be a little bit surprising for you. But, if you run two instances of consumer, which listens for the whole topic each instance would process message from the single partition.
2018-01-30 11:09:08 [INFO ]  Processing: key=null, value={"type":"MULTIPLE","status":"NEW","price":400}, partition=1, offset=0
2018-01-30 11:09:27 [INFO ]  Processing: key=null, value={"type":"MULTIPLE","status":"NEW","price":500,"relatedOrderId":0}, partition=1, offset=1
Summary
In this article I was trying to give you a little bit of messaging with Apache Kafka. Such concepts like consumer groups or partitioning are something what makes it different from traditional messaging solutions. Kafka is widely adopted product, which can acts as storage, messaging system or stream processor. Together with popular JVM based toolkit Vert.x it may be really powerful, fast and lightweight solution for your applications that exchanges messages between each other. The key concepts introduced by Kafka has been adopted by Spring Cloud Stream, which makes them as an opinionated choice for creating messaging microservices.
RabbitMQ in cluster
Posted on by Piotr Mińkowski
RabbitMQ grown into the most popular message broker software. It is written in Erlang and implements Advanced Message Queueing Protocol (AMQP). It is easy to use and configure even if we are talking about such mechanisms as clustering or high availibility. In this post I’m going to show you how to run some instances of RabbitMQ provided in docker containers in the cluster with highly available (HA) queues. Based on the sample Java application we’ll see how to send and receive messages from the RabbitMQ cluster and check how this message broker handles a large number of incoming messages. Sample Spring Boot application is available on GitHub. Here is picture ilustrating architecture of the presented solution.

We use docker official repository of RabbitMQ. Here are commands for running three RabbitMQ nodes. First node is the master of cluster – two other nodes will join him. We use container management to enable an UI administration console for each node. Every node has default connection and UI management ports exposed. Important thing is to link rabbit2 and rabbit3 constainers to rabbit1, which is necessary while joining to cluster mastering by rabbit1.
docker run -d --hostname rabbit1 --name rabbit1 -e RABBITMQ_ERLANG_COOKIE='rabbitcluster' -p 30000:5672 -p 30001:15672 rabbitmq:management
docker run -d --hostname rabbit2 --name rabbit2 --link rabbit1:rabbit1 -e RABBITMQ_ERLANG_COOKIE='rabbitcluster' -p 30002:5672 -p 30003:15672 rabbitmq:management
docker run -d --hostname rabbit3 --name rabbit3 --link rabbit1:rabbit1 -e RABBITMQ_ERLANG_COOKIE='rabbitcluster' -p 30004:5672 -p 30005:15672 rabbitmq:management
Ok, now there are three RabbitMQ running instances. We can go to the UI management console for all of those instances available as docker containers, for example http://192.168.99.100:30001 (rabbitmq). Each instance is available on its independent cluster like we see in the pictures below. We would like to make all instances working in same cluster rabbit@rabbit1.


Here’s set of commands run on rabbit2 instance for joining cluster rabbit@rabbit1. The same set should be run on rabbit3 node. In the beginning we have to connect to docker container and run bash command. Before running rabbitmq join_cluster command we have to stop broker.
docker exec -i -t rabbit2 \bash
root@rabbit2:/# rabbitmqctl stop_app
Stopping node rabbit@rabbit2 ...
root@rabbit2:/# rabbitmqctl join_cluster rabbit@rabbit1
Clustering node rabbit@rabbit2 with rabbit@rabbit1 ...
root@rabbit2:/# rabbitmqctl start_app
Starting node rabbit@rabbit2 ...
If everything was successful we should see cluster name rabbit@rabbit1 in upper right corner of rabbit2 management console. You should also see list of running nodes in the Nodes section. You can also check cluster status by running on every node command rabbitmqctl cluster_status, which should also display list of all cluster nodes.

After starting all nodes go to UI managent console on one of nodes. Now we are going to configure High Availibility for selected queue. It is not important which node you choose, because they are in one cluster. In the Queues tab create queue with name q.example. Then go to Admin tab and select Policies section and create new policy. In the picture below you can see policy I have created. I selected ha-mode=all which means that is mirrored across all nodes in the cluster and when new node is added to the cluster, the queue will be mirrored to that node. There are also available exactly, nodes modes – more about RabbitMQ High Availibility you can find here. In pattern field enter your queue name and in apply to select Queues. If everything was succeded you should see ha-all feature in queue row.

One of the greatest advantage of RabbitMQ is monitoring. You can see many statistics like memory, disk usage, I/O statistics, detailed message rates, graphs etc. Some of them you could see below.


RabbitMQ has a great support in Spring framework. There many projects in which use RabbitMQ implementation by default, for example Spring Cloud Stream, Spring Cloud Sleuth. I’m going to show you sample Spring Boot application that sends messages to RabbitMQ cluster and receives them from HA queue. Application source code is available on GitHub. Here’s main class of application. We enable RabbitMQ listener by declaring @EnableRabbit on class and @RabbitListener on receiving method. We also have to declare listened queue, broker connection factory and listener container factory to allow listener concurrency. Inside CachingConnectionFactory we set all three addresses of RabbitMQ cluster instances: 192.168.99.100:30000, 192.168.99.100:30002, 192.168.99.100:30004.
@SpringBootApplication
@EnableRabbit
public class Listener {

	private static Logger logger = Logger.getLogger("Listener");

	public static void main(String[] args) {
		SpringApplication.run(Listener.class, args);
	}

	@RabbitListener(queues = "q.example")
	public void onMessage(Order order) {
		logger.info(order.toString());
	}

	@Bean
	public ConnectionFactory connectionFactory() {
		CachingConnectionFactory connectionFactory = new CachingConnectionFactory();
		connectionFactory.setUsername("guest");
		connectionFactory.setPassword("guest");
		connectionFactory.setAddresses("192.168.99.100:30000,192.168.99.100:30002,192.168.99.100:30004");
		connectionFactory.setChannelCacheSize(10);
		return connectionFactory;
	}

	@Bean
	public SimpleRabbitListenerContainerFactory rabbitListenerContainerFactory() {
		SimpleRabbitListenerContainerFactory factory = new SimpleRabbitListenerContainerFactory();
		factory.setConnectionFactory(connectionFactory());
		factory.setConcurrentConsumers(10);
		factory.setMaxConcurrentConsumers(20);
		return factory;
	}

	@Bean
	public Queue queue() {
		return new Queue("q.example");
	}

}
Conclusion
Clustering and High Availibility configuration with RabbitMQ is pretty simple. I like Rabbit MQ for support in the cluster monitoring process with UI management console. In my opinion it is user friendly and intuitive. In the sample application I send 100k messages into the sample queue. Using 20 concurrent consumers they were processed 65 seconds (~80/s per consumer thread) and memory usage at its peak was about 400MB on each node. Of cource our application is just receiving object message and logging it in console.
Event driven microservices using Spring Cloud Stream and RabbitMQ
Posted on by Piotr Mińkowski
Before we start let’s look at site Spring Cloud Quick Start. There is a list of spring-cloud releases available grouped as release trains. We use the newest release Camden.SR5 with 1.4.4.RELEASE Spring Boot and Brooklyn.SR2 Spring Cloud Stream version.
<parent>
	<groupId>org.springframework.boot</groupId>
	<artifactId>spring-boot-starter-parent</artifactId>
	<version>1.4.4.RELEASE</version>
</parent>
<dependencyManagement>
	<dependencies>
		<dependency>
			<groupId>org.springframework.cloud</groupId>
			<artifactId>spring-cloud-dependencies</artifactId>
			<version>Camden.SR5</version>
			<type>pom</type>
			<scope>import</scope>
		</dependency>
	</dependencies>
</dependencyManagement>
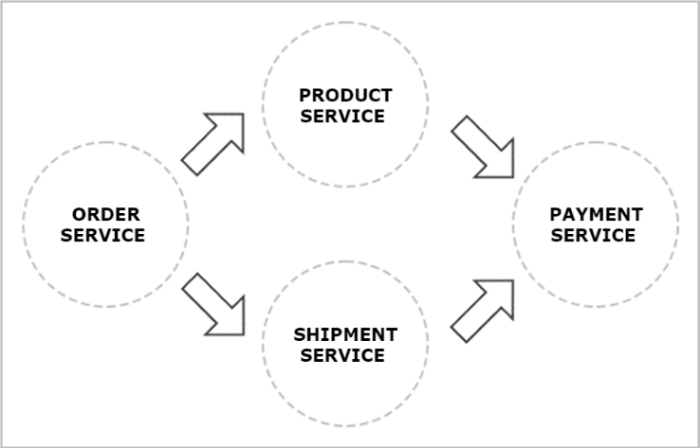
Here’s our architecture visualization. Order service sends message to RabbitMQ topic exchange. Product and shipment services listen on that topic for incoming order messages and then process them. After processing they send reply message to the topic on which payment service listens to. Payment service stores incoming messages aggregating reply from product and shipment services, then count prices and sends final response.
Each service has the following dependencies. We have sample-common module where object for messages sent to topics are stored. They’re shared between all services. We’re also using Spring Cloud Sleuth for distributed tracing with one request id between all microservices.
	<dependencies>
		<dependency>
			<groupId>org.springframework.cloud</groupId>
			<artifactId>spring-cloud-stream</artifactId>
		</dependency>
		<dependency>
			<groupId>org.springframework.cloud</groupId>
			<artifactId>spring-cloud-stream-binder-rabbit</artifactId>
		</dependency>
		<dependency>
			<groupId>org.springframework.cloud</groupId>
			<artifactId>spring-cloud-starter-sleuth</artifactId>
		</dependency>
		<dependency>
			<groupId>pl.piomin.services</groupId>
			<artifactId>sample-common</artifactId>
			<version>${project.version}</version>
		</dependency>
	</dependencies>
Let me start with a few words on the theoretical aspects of Spring Cloud stream. Here’s short reference of that framework Spring Cloud Stream Reference Guide. It’s based on Spring Integration. It provides three predefined interfaces out of the box:
- Source – can be used for an application which has a single outbound channel
- Sink – can be used for an application which has a single inbound channel
- Processor – can be used for an application which has both an inbound channel and an outbound channel
I’m going to show you sample usage of all of these interfaces. In order service we’re using Source class. Using @InboundChannelAdapter and @Poller annotations we’are sending order message to output once per 10 seconds.
@SpringBootApplication
@EnableBinding(Source.class)
public class Application {

	protected Logger logger = Logger.getLogger(Application.class.getName());

	private int index = 0;

	public static void main(String[] args) {
		SpringApplication.run(Application.class, args);
	}

	@Bean
	@InboundChannelAdapter(value = Source.OUTPUT, poller = @Poller(fixedDelay = "10000", maxMessagesPerPoll = "1"))
	public MessageSource<Order> orderSource() {
		return () -> {
			Order o = new Order(index++, OrderType.PURCHASE, LocalDateTime.now(), OrderStatus.NEW, new Product(), new Shipment());
			logger.info("Sending order: " + o);
			return new GenericMessage<>(o);
		};
	}

	@Bean
	public AlwaysSampler defaultSampler() {
	  return new AlwaysSampler();
	}

}
Here’s output configuration in application.yml file.
spring:
  cloud:
    stream:
      bindings:
        input:
          destination: ex.stream.in
          binder: rabbit1
        output:
          destination: ex.stream.out
          binder: rabbit1
      binders:
        rabbit1:
          type: rabbit
          environment:
            spring:
              rabbitmq:
                host: 192.168.99.100
                port: 30000
                username: guest
                password: guest
Product and shipment services use Processor interface. They listen on stream input and after processing send message to their outputs.
@SpringBootApplication
@EnableBinding(Processor.class)
public class Application {

	@Autowired
	private ProductService productService;

	protected Logger logger = Logger.getLogger(Application.class.getName());

	public static void main(String[] args) {
		SpringApplication.run(Application.class, args);
	}

	@StreamListener(Processor.INPUT)
	@SendTo(Processor.OUTPUT)
	public Order processOrder(Order order) {
		logger.info("Processing order: " + order);
		return productService.processOrder(order);
	}

	@Bean
	public AlwaysSampler defaultSampler() {
		return new AlwaysSampler();
	}

}
Here’s service configuration. It listens on order service output exchange and also defines its group named product. That group name will be used for automatic queue creation and exchange binding on RabbitMQ. There is also output exchange defined.
spring:
  cloud:
    stream:
      bindings:
        input:
          destination: ex.stream.out
          group: product
          binder: rabbit1
        output:
          destination: ex.stream.out2
          binder: rabbit1
      binders:
        rabbit1:
          type: rabbit
          environment:
            spring:
              rabbitmq:
                host: 192.168.99.100
                port: 30000
                username: guest
                password: guest
We use docker container for running RabbitMQ instance.
docker run -d --name rabbit1 -p 30001:15672 -p 30000:5672 rabbitmq:management
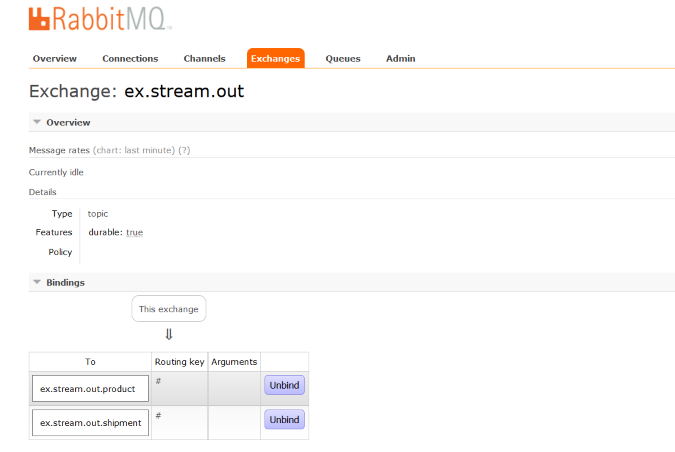
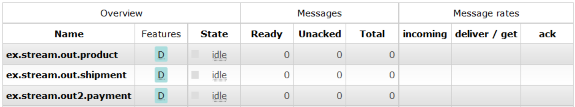
Let’s look at the management console. It’s available on http://192.168.99.100:30001. Here’s ex.stream.out topic exchange configuration. Below we see the list of declared queues.
Here’s main application class from payment service. We use Sink interface for listening on incoming messages. Input order is processed and we print final price of order sent by order service. Sample application source code is available on GitHub.
@SpringBootApplication
@EnableBinding(Sink.class)
public class Application {

	@Autowired
	private PaymentService paymentService;

	protected Logger logger = Logger.getLogger(Application.class.getName());

	public static void main(String[] args) {
		SpringApplication.run(Application.class, args);
	}

	@StreamListener(Sink.INPUT)
	public void processOrder(Order order) {
		logger.info("Processing order: " + order);
		Order o = paymentService.processOrder(order);
		if (o != null)
			logger.info("Final response: " + (o.getProduct().getPrice() + o.getShipment().getPrice()));
	}

	@Bean
	public AlwaysSampler defaultSampler() {
		return new AlwaysSampler();
	}

}
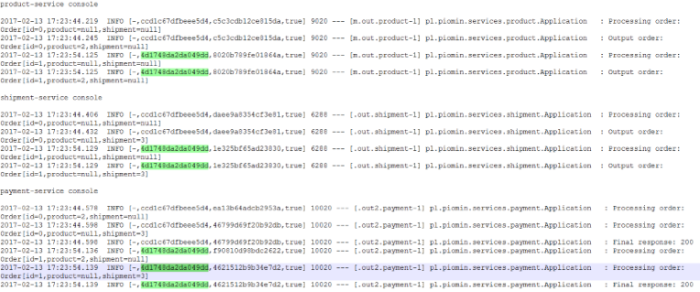
By using @Bean AlwaysSampler in every main class of our microservices we propagate one trace and span id between all calls of single order. Here’s fragment from our microservices logging console. And also I get the following warning message which is not understable for me: ‘Deprecated trace headers detected. Please upgrade Sleuth to 1.1 or start sending headers present in the TraceMessageHeaders class’. Version 1.1.2.RELEASE of Spring Cloud Sleuth is not applicable Camden.SR5 release?
How to ship logs with Logstash, Elasticsearch and RabbitMQ
Posted on by Piotr Mińkowski
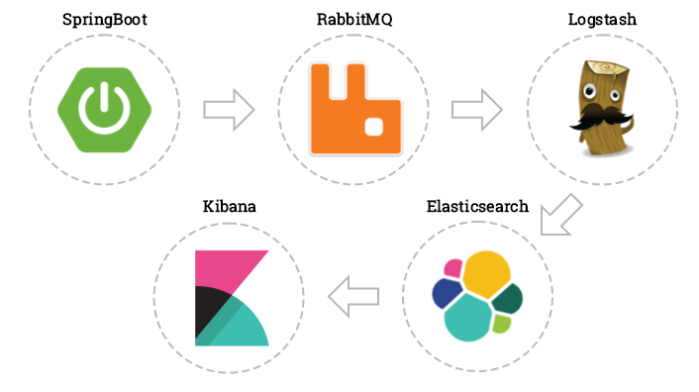
Here’s simple picture of our solution. We’ll start from sample Spring Boot application shipping logs to RabbitMQ exchange. Then using Docker, we’ll configure environment containing RabbitMQ, Logstash, Elasticsearch and Kibana – each running on separated Docker container.
My sample Java application is available on https://github.com/piomin/sample-amqp-logging.git.
There are only two Spring Boot dependencies needed inside pom.xml. First for REST controller and second for AMQP dependencies.
<dependencies>
	<dependency>
		<groupId>org.springframework.boot</groupId>
		<artifactId>spring-boot-starter-data-rest</artifactId>
	</dependency>
	<dependency>
		<groupId>org.springframework.boot</groupId>
		<artifactId>spring-boot-starter-amqp</artifactId>
	</dependency>
</dependencies>
Here’s simple controller with one logging message.
import org.slf4j.Logger;
import org.slf4j.LoggerFactory;
import org.springframework.web.bind.annotation.PathVariable;
import org.springframework.web.bind.annotation.RequestMapping;
import org.springframework.web.bind.annotation.RestController;

@RestController
public class Controller {

 protected Logger logger = LoggerFactory.getLogger(Controller.class.getName());

 @RequestMapping("/hello/{param}")
 public String hello(@PathVariable("param") String param) {
  logger.info("Controller.hello(" + param + ")");
  return "Hello";
 }

}
I use logback as logger implementation and Spring AMQP appender for sending logs to RabbitMQ over AMQP protocol.
<appender name="AMQP" class="org.springframework.amqp.rabbit.logback.AmqpAppender">
	<layout>
		<pattern>
			{
			"time": "%date{ISO8601}",
			"thread": "%thread",
			"level": "%level",
			"class": "%logger{36}",
			"message": "%message"
			}
		</pattern>
	</layout>

	<!-- RabbitMQ connection -->
	<host>192.168.99.100</host>
	<port>30000</port>
	<username>guest</username>
	<password>guest</password>

	<applicationId>api-service-4</applicationId>
	<routingKeyPattern>api-service-4</routingKeyPattern>
	<declareExchange>true</declareExchange>
	<exchangeType>direct</exchangeType>
	<exchangeName>ex_logstash</exchangeName>

	<generateId>true</generateId>
	<charset>UTF-8</charset>
	<durable>true</durable>
	<deliveryMode>PERSISTENT</deliveryMode>
</appender>
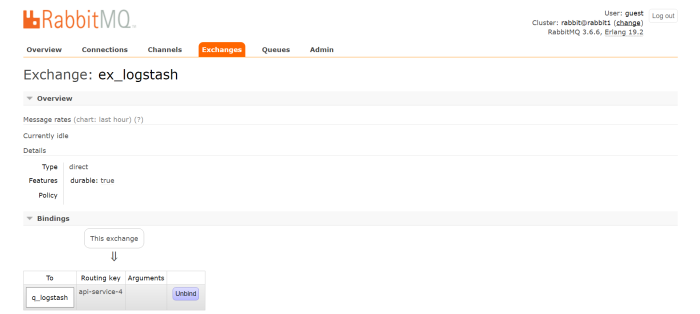
I run RabbitMQ server using docker image https://hub.docker.com/_/rabbitmq/. Here’s docker command for it. I choosed rabbitmq:management docker image to enable expose of RabbitMQ UI management console on port 30001. After running this command we can go to management console available on 192.168.99.100:30001. There we have to create queue named q_logstash and direct exchange named ex_logstach having routing set to q_logstash queue.
docker run -d -it --name rabbit --hostname rabbit -p 30000:5672 -p 30001:15672
 rabbitmq:management
Then we run Elasticsearch and Kibana docker images. Kibana container need to be linked to elasticsearch.
docker run -d -it --name es -p 9200:9200 -p 9300:9300 elasticsearch
docker run -d -it --name kibana --link es:elasticsearch -p 5601:5601 kibana
Finally we can run Logstash docker image which get RabbitMQ queue as input and set Elasticsearch api as output. We have to change host to docker machine default address and port configured when running RabbitMQ container. Also we have durable queue so it has to be changed because default value for that is false following this reference:https://www.elastic.co/guide/en/logstash/current/plugins-inputs-rabbitmq.html
docker run -d -it --name logstash logstash -e 'input { rabbitmq {
host => "192.168.99.100" port => 30000 durable => true } }
output { elasticsearch { hosts => ["192.168.99.100"] } }'
After running all docker containers for RabbitMQ, Logstash, Elasticsearch and Kibana we can run our sample Spring Boot application and see logs on Kibana available on http://192.168.99.100:5601.
