Guide to Quarkus with Kotlin

Quarkus is a lightweight Java framework developed by RedHat. It is dedicated for cloud-native applications that require a small memory footprint and a fast startup time. Its programming model is built on top of proven standards like Eclipse MicroProfile. Recently it is growing in popularity. It may be considered as an alternative to Spring Boot framework, especially if you are running your applications on Kubernetes or OpenShift. Continue reading “Guide to Quarkus with Kotlin”

Spring Boot Autoscaler

One of more important reasons we are deciding to use such a tools like Kubernetes, Pivotal Cloud Foundry or HashiCorp’s Nomad is an availability of auto-scaling our applications. Of course those tools provides many other useful mechanisms, but we can implement auto-scaling by ourselves. At first glance it seems to be difficult, but assuming we use Spring Boot as a framework for building our applications and Jenkins as a CI server, it finally does not require a lot of work. Today, I’m going to show you how to implement such a solutions using the following frameworks/tools:

  • Spring Boot
  • Spring Boot Actuator
  • Spring Cloud Netflix Eureka
  • Jenkins CI

How it works?

Every Spring Boot application, which contains Spring Boot Actuator library can expose metrics under endpoint /actuator/metrics. There are many valuable metrics that gives you the detailed information about an application status. Some of them may be especially important when talking about autoscaling: JVM, CPU metrics, a number of running threads and a number of incoming HTTP requests. There is dedicated Jenkins pipeline responsible for monitoring application’s metrics by polling endpoint /actuator/metrics periodically. If any monitored metrics is below or above target range it runs new instance or shutdown a running instance of application using another Actuator endpoint /actuator/shutdown. Before that, it needs to fetch the current list of running instances of a single application in order to get an address of existing application selected for shutting down or the address of server with the smallest number of running instances for a new instance of application..

spring-autoscaler-1

After discussing an architecture of our system we may proceed to the development. Our application needs to meet some requirements: it has to expose metrics and endpoint for graceful shutdown, it needs to register in Eureka after after startup and deregister on shutdown, and finally it also should dynamically allocate running port randomly from the pool of free ports. Thanks to Spring Boot we may easily implement all these mechanisms if five minutes 🙂

Dynamic port allocation

Since it is possible to run many instances of application on a single machine we have to guarantee that there won’t be conflicts in port numbers. Fortunately, Spring Boot provides such mechanisms for an application. We just need to set port number to 0 inside application.yml file using server.port property. Because our application registers itself in eureka it also needs to send unique instanceId, which is by default generated as a concatenation of fields spring.cloud.client.hostname, spring.application.name and server.port.
Here’s current configuration of our sample application. I have changed the template of instanceId field by replacing number of port to randomly generated number.

spring:
  application:
    name: example-service
server:
  port: ${PORT:0}
eureka:
  instance:
    instanceId: ${spring.cloud.client.hostname}:${spring.application.name}:${random.int[1,999999]}

Enabling Actuator metrics

To enable Spring Boot Actuator we need to include the following dependency to pom.xml.

<dependency>
	<groupId>org.springframework.boot</groupId>
	<artifactId>spring-boot-starter-actuator</artifactId>
</dependency>

We also have to enable exposure of actuator endpoints via HTTP API by setting property management.endpoints.web.exposure.include to '*'. Now, the list of all available metric names is available under context path /actuator/metrics, while detailed information for each metric under path /actuator/metrics/{metricName}.

Graceful shutdown

Besides metrics Spring Boot Actuator also provides endpoint for shutting down an application. However, in contrast to other endpoints this endpoint is not available by default. We have to set property management.endpoint.shutdown.enabled to true. After that we will be to stop our application by sending POST request to /actuator/shutdown endpoint.
This method of stopping application guarantees that service will unregister itself from Eureka server before shutdown.

Enabling Eureka discovery

Eureka is the most popular discovery server used for building microservices-based architecture with Spring Cloud. So, if you already have microservices and want to provide auto-scaling mechanisms for them, Eureka would be a natural choice. It contains IP address and port number of every registered instance of application. To enable Eureka on the client side you just need to include the following dependency to your pom.xml.

<dependency>
	<groupId>org.springframework.cloud</groupId>
	<artifactId>spring-cloud-starter-netflix-eureka-client</artifactId>
</dependency>

As I have mentioned before we also have to guarantee an uniqueness of instanceId send to Eureka server by client-side application. It has been described in the step “Dynamic port allocation”.
The next step is to create application with embedded Eureka server. To achieve it we first need to include the following dependency into pom.xml.

<dependency>
	<groupId>org.springframework.cloud</groupId>
	<artifactId>spring-cloud-starter-netflix-eureka-server</artifactId>
</dependency>

The main class should be annotated with @EnableEurekaServer.

@SpringBootApplication
@EnableEurekaServer
public class DiscoveryApp {

    public static void main(String[] args) {
        new SpringApplicationBuilder(DiscoveryApp.class).run(args);
    }

}

Client-side applications by default tries to connect with Eureka server on localhost under port 8761. We only need single, standalone Eureka node, so we will disable registration and attempts to fetching list of services form another instances of server.

spring:
  application:
    name: discovery-service
server:
  port: ${PORT:8761}
eureka:
  instance:
    hostname: localhost
  client:
    registerWithEureka: false
    fetchRegistry: false
    serviceUrl:
      defaultZone: http://localhost:8761/eureka/

The tests of the sample autoscaling system will be performed using Docker containers, so we need to prepare and build image with Eureka server. Here’s Dockerfile with image definition. It can be built using command docker build -t piomin/discovery-server:2.0 ..

FROM openjdk:8-jre-alpine
ENV APP_FILE discovery-service-1.0-SNAPSHOT.jar
ENV APP_HOME /usr/apps
EXPOSE 8761
COPY target/$APP_FILE $APP_HOME/
WORKDIR $APP_HOME
ENTRYPOINT ["sh", "-c"]
CMD ["exec java -jar $APP_FILE"]

Building Jenkins pipeline for autoscaling

The first step is to prepare Jenkins pipeline responsible for autoscaling. We will create Jenkins Declarative Pipeline, which runs every minute. Periodical execution may be configured with the triggers directive, that defines the automated ways in which the pipeline should be re-triggered. Our pipeline will communicate with Eureka server and metrics endpoints exposed by every microservice using Spring Boot Actuator.
The test service name is EXAMPLE-SERVICE, which is equal to value (big letters) of property spring.application.name defined inside application.yml file. The monitored metric is the number of HTTP listener threads running on Tomcat container. These threads are responsible for processing incoming HTTP requests.

pipeline {
    agent any
    triggers {
        cron('* * * * *')
    }
    environment {
        SERVICE_NAME = "EXAMPLE-SERVICE"
        METRICS_ENDPOINT = "/actuator/metrics/tomcat.threads.busy?tag=name:http-nio-auto-1"
        SHUTDOWN_ENDPOINT = "/actuator/shutdown"
    }
    stages { ... }
}

Integrating Jenkins pipeline with Eureka

The first stage of our pipeline is responsible for fetching list of services registered in service discovery server. Eureka exposes HTTP API with several endpoints. One of them is GET /eureka/apps/{serviceName}, which returns list of all instances of application with given name. We are saving the number of running instances and the URL of metrics endpoint of every single instance. These values would be accessed during next stages of pipeline.
Here’s the fragment of pipeline responsible for fetching list of running instances of application. The name of stage is Calculate. We use HTTP Request Plugin for HTTP connections.

stage('Calculate') {
	steps {
		script {
			def response = httpRequest "http://192.168.99.100:8761/eureka/apps/${env.SERVICE_NAME}"
			def app = printXml(response.content)
			def index = 0
			env["INSTANCE_COUNT"] = app.instance.size()
			app.instance.each {
				if (it.status == 'UP') {
					def address = "http://${it.ipAddr}:${it.port}"
					env["INSTANCE_${index++}"] = address 
				}
			}
		}
	}
}

@NonCPS
def printXml(String text) {
    return new XmlSlurper(false, false).parseText(text)
}

Here’s a sample response from Eureka API for our microservice. The response content type is XML.

spring-autoscaler-2

Integrating Jenkins pipeline with Spring Boot Actuator metrics

Spring Boot Actuator exposes endpoint with metrics, which allows to find metric by name and optionally by tag. In the fragment of pipeline visible below I’m trying to find the instance with metric below or above a defined threshold. If there is such an instance we stop the loop in order to proceed to the next stage, which performs scaling down or up. The ip addresses of running applications are taken from pipeline environment variable with prefix INSTANCE_, which has been saved in the previous stage.

stage('Metrics') {
	steps {
		script {
			def count = env.INSTANCE_COUNT
			for(def i=0; i<count; i++) {
				def ip = env["INSTANCE_${i}"] + env.METRICS_ENDPOINT
				if (ip == null)
					break;
				def response = httpRequest ip
				def objRes = printJson(response.content)
				env.SCALE_TYPE = returnScaleType(objRes)
				if (env.SCALE_TYPE != "NONE")
					break
			}
		}
	}
}

@NonCPS
def printJson(String text) {
    return new JsonSlurper().parseText(text)
}

def returnScaleType(objRes) {
def value = objRes.measurements[0].value
if (value.toInteger() > 100)
		return "UP"
else if (value.toInteger() < 20)
		return "DOWN"
else
		return "NONE"
}

Shutdown application instance

In the last stage of our pipeline we will shutdown the running instance or start new instance depending on the result saved in the previous stage. Shutdown may be easily performed by calling Spring Boot Actuator endpoint. In the following fragment of pipeline we pick the instance returned by Eureka as first. Then we send POST request to that ip address.
If we need to scale up our application we call another pipeline responsible for build fat JAR and launch it on our machine.

stage('Scaling') {
	steps {
		script {
			if (env.SCALE_TYPE == 'DOWN') {
				def ip = env["INSTANCE_0"] + env.SHUTDOWN_ENDPOINT
				httpRequest url:ip, contentType:'APPLICATION_JSON', httpMode:'POST'
			} else if (env.SCALE_TYPE == 'UP') {
				build job:'spring-boot-run-pipeline'
			}
			currentBuild.description = env.SCALE_TYPE
		}
	}
}

Here’s a full definition of our pipeline spring-boot-run-pipeline responsible for starting new instance of application. It clones the repository with application source code, builds binaries using Maven commands, and finally runs the application using java -jar command passing address of Eureka server as a parameter.

pipeline {
    agent any
    tools {
        maven 'M3'
    }
    stages {
        stage('Checkout') {
            steps {
                git url: 'https://github.com/piomin/sample-spring-boot-autoscaler.git', credentialsId: 'github-piomin', branch: 'master'
            }
        }
        stage('Build') {
            steps {
                dir('example-service') {
                    sh 'mvn clean package'
                }
            }
        }
        stage('Run') {
            steps {
                dir('example-service') {
                    sh 'nohup java -jar -DEUREKA_URL=http://192.168.99.100:8761/eureka target/example-service-1.0-SNAPSHOT.jar 1>/dev/null 2>logs/runlog &'
                }
            }
        }
    }
}

Remote extension

The algorithm discussed in the previous sections will work fine only for microservices launched on the single machine. If we would like to extend it to work with many machines, we will have to modify our architecture as shown below. Each machine has Jenkins agent running and communicating with Jenkins master. If we would like to start new instance of microservices on the selected machine, we have to run pipeline using agent running on that machine. This agent is responsible only for building application from source code and launching it on the target machine. The shutdown of instance is still performed just by calling HTTP endpoint.

spring-autoscaler-3

You can find more information about running Jenkins agents and connecting them with Jenkins master via JNLP protocol in my article Jenkins nodes on Docker containers. Assuming we have successfully launched some agents on the target machines we need to parametrize our pipelines in order to be able to select agent (and therefore the target machine) dynamically.
When we are scaling up our application we have to pass agent label to the downstream pipeline.

build job:'spring-boot-run-pipeline', parameters:[string(name: 'agent', value:"slave-1")]

The calling pipeline will be ran by agent labelled with given parameter.

pipeline {
    agent {
        label "${params.agent}"
    }
    stages { ... }
}

If we have more than one agent connected to the master node we can map their addresses into the labels. Thanks to that you would be able to map IP address of microservice instance fetched from Eureka to the target machine with Jenkins agent.

pipeline {
    agent any
    triggers {
        cron('* * * * *')
    }
    environment {
        SERVICE_NAME = "EXAMPLE-SERVICE"
        METRICS_ENDPOINT = "/actuator/metrics/tomcat.threads.busy?tag=name:http-nio-auto-1"
        SHUTDOWN_ENDPOINT = "/actuator/shutdown"
        AGENT_192.168.99.102 = "slave-1"
        AGENT_192.168.99.103 = "slave-2"
    }
    stages { ... }
}

Summary

In this article I have demonstrated how to use Spring Boot Actuator metrics in order to scale up/scale down your Spring Boot application. Using basic mechanisms provided by Spring Boot together with Spring Cloud Netflix Eureka and Jenkins you can implement auto-scaling for your applications without getting any other third-party tools. The case described in this article assumes using Jenkins agents on the remote machines to launch there new instance of application, but you may as well use a tool like Ansible for that. If you would decide to run Ansible playbooks from Jenkins you will not have to launch Jenkins agents on remote machines. The source code with sample applications is available on GitHub: https://github.com/piomin/sample-spring-boot-autoscaler.git.

Exporting metrics to InfluxDB and Prometheus using Spring Boot Actuator

Spring Boot Actuator is one of the most modified projects after release of Spring Boot 2. It has been through the major improvements, which aimed to simplify customization, and include some new features like support for other web technologies, for example the new reactive module – Spring WebFlux. It also adds out-of-the-box support for exporting metrics to InfluxDB – an open source time series database designed to handle high volumes of timestamped data.  It is really a great simplification in comparison to the version used with Spring Boot 1.5. You can see for yourself how much by reading one of my previous articles Custom metrics visualization with Grafana and InfluxDB. I described there how to export metrics generated by Spring Boot Actuator to InfluxDB using @ExportMetricsWriter bean. The sample Spring Boot application has been available for that article on GitHub repository sample-spring-graphite (https://github.com/piomin/sample-spring-graphite.git) in the branch master. For the current article, I have created the branch spring2 (https://github.com/piomin/sample-spring-graphite/tree/spring2), which show how to implement the same feature as before using version 2.0 of Spring Boot and Spring Boot Actuator.

Additionally, I’m going to show you how to export the same metrics to another popular monitoring system for efficiently storing timeseries data – Prometheus. There is one major difference between models of exporting metrics between InfluxDB and Prometheus. First of them is a push based system, while the second is a pull based system. So, our sample application needs to to actively send data to the InfluxDB monitoring system, while with Prometheus it only has to expose endpoint that will be fetched for data periodically. Let’s begin from InfluxDB.

1. Running InfluxDB

In the previous article I didn’t write much about this database and its configuration. So, now I say some words about it. First step is typical for my examples – we will run Docker container with InfluxDB. Here’s the simplest command that run InfluxDB on your local machine and exposes HTTP API over 8086 port.

$ docker run -d --name influx -p 8086:8086 influxdb

Once we started that container, you would probably want to login there and execute some commands. Nothing simpler, just run the following command and you would be able to do it. After login you should see the version of InfluxDB running on the target Docker container.

$ docker exec -it influx influx
Connected to http://localhost:8086 version 1.5.2
InfluxDB shell version: 1.5.2

The first step is to create database. As you can probably guess, tt can be achieved using command create database. Then switch to the newly created database.

$ create database springboot
$ use springboot

Is that semantic looks familiar for you? Yes, InfluxDB provides very similar query language to SQL. It is called InluxQL, and allows you to define SELECT statements, GROUP BY or INTO clauses, and many more. However, before executing such queries, we should have data stored inside database, am I right? Now, let’s proceed to the next steps in order to generate some test metrics.

2. Integrating Spring Boot application with InfluxDB

If you include artifact micrometer-registry-influx to the project’s dependencies, an export to InfluxDB will be enabled automatically. Of course, we also need to include starter spring-boot-starter-actuator.

<dependency>
	<groupId>org.springframework.boot</groupId>
	<artifactId>spring-boot-starter-actuator</artifactId>
</dependency>
<dependency>
	<groupId>io.micrometer</groupId>
	<artifactId>micrometer-registry-influx</artifactId>
</dependency>

The only thing you have to do is to override default address of InfluxDB, because we are running InfluxDB Docker container on VM. By default, Spring Boot Data tries to connect database named mydb. However, I have already created database springboot, so I should also override this default value. In the version 2 of Spring Boot all the configuration properties related to Spring Boot Actuator endpoints has been moved to management.* section.

management:
  metrics:
    export:
      influx:
        db: springboot
        uri: http://192.168.99.100:8086

You may be surprised a little after starting Spring Boot application with actuator included on the classpath, that it exposes only two HTTP endpoints by default /actuator/info and /actuator/health. That’s why in the newest version of Spring Boot all actuators other than /health and /info are disabled by default, for security purposes. To enable all the actuator enpoints, you have to set property management.endpoints.web.exposure.include to '*'.
In the newest version of Spring Boot monitoring of HTTP metrics has been improved significantly. We can enable collecting all Spring MVC metrics by setting the property management.metrics.web.server.auto-time-requests to true. Alternatively, when it is set to false, you can enable metrics for the specific REST controller by annotating it with @Timed. You can also annotate a single method inside controller, to generate metrics only for specific endpoint.
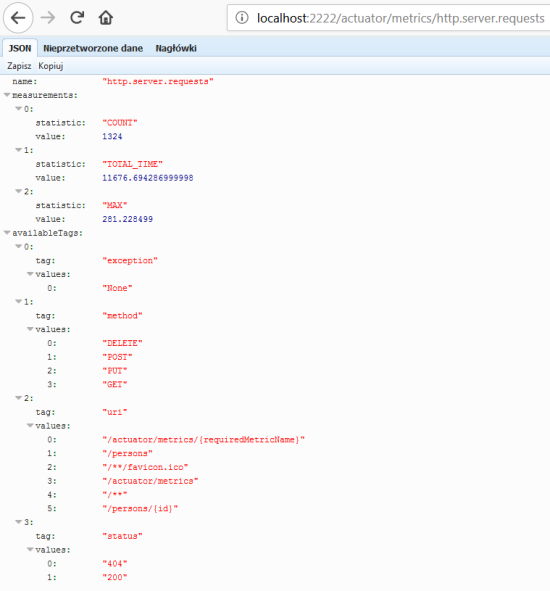
After application boot you may check out the full list of generated metrics by calling endpoint GET /actuator/metrics. By default, metrics for Spring MVC controller are generated under the name http.server.requests. This name can be customized by setting the management.metrics.web.server.requests-metric-name property. If you run the sample application available inside my GitHub repository it is by default available uder port 2222. Now, you can check out the list of statistics generated for a single metric by calling the endpoint GET /actuator/metrics/{requiredMetricName}, as shown in the following picture.

actuator-6

3. Building Spring Boot application

The sample Spring Boot application used for generating metrics consists of a single controller that implements basic CRUD operations for manipulating Person entity, repository bean and entity class. The application connects to MySQL database using Spring Data JPA repository providing CRUD implementation. Here’s the controller class.

@RestController
@Timed
public class PersonController {

	protected Logger logger = Logger.getLogger(PersonController.class.getName());

	@Autowired
	PersonRepository repository;

	@GetMapping("/persons/pesel/{pesel}")
	public List findByPesel(@PathVariable("pesel") String pesel) {
		logger.info(String.format("Person.findByPesel(%s)", pesel));
		return repository.findByPesel(pesel);
	}

	@GetMapping("/persons/{id}")
	public Person findById(@PathVariable("id") Integer id) {
		logger.info(String.format("Person.findById(%d)", id));
		return repository.findById(id).get();
	}

	@GetMapping("/persons")
	public List findAll() {
		logger.info(String.format("Person.findAll()"));
		return (List) repository.findAll();
	}

	@PostMapping("/persons")
	public Person add(@RequestBody Person person) {
		logger.info(String.format("Person.add(%s)", person));
		return repository.save(person);
	}

	@PutMapping("/persons")
	public Person update(@RequestBody Person person) {
		logger.info(String.format("Person.update(%s)", person));
		return repository.save(person);
	}

	@DeleteMapping("/persons/{id}")
	public void remove(@PathVariable("id") Integer id) {
		logger.info(String.format("Person.remove(%d)", id));
		repository.deleteById(id);
	}

}

Before running the application we have setup MySQL database. The most convenient way to achieve it is through MySQL Docker image. Here’s the command that runs container with database grafana, defines user and password, and exposes MySQL 5 on port 33306.

docker run -d --name mysql -e MYSQL_DATABASE=grafana -e MYSQL_USER=grafana -e MYSQL_PASSWORD=grafana -e MYSQL_ALLOW_EMPTY_PASSWORD=yes -p 33306:3306 mysql:5

Then we need to set some database configuration properties on the application side. All the required tables will be created on application’s boot thanks to setting property spring.jpa.properties.hibernate.hbm2ddl.auto to update.

spring:
  datasource:
    url: jdbc:mysql://192.168.99.100:33306/grafana?useSSL=false
    username: grafana
    password: grafana
    driverClassName: com.mysql.jdbc.Driver
  jpa:
    properties:
      hibernate:
        dialect: org.hibernate.dialect.MySQL5Dialect
        hbm2ddl.auto: update

4. Generating metrics

After starting the application and the required Docker containers, the only thing that needs to be is done is to generate some test statistics. I created JUnit test class that generates some test data and calls endpoints exposed by the application in a loop. Here’s the fragment of that test method.

int ix = new Random().nextInt(100000);
Person p = new Person();
p.setFirstName("Jan" + ix);
p.setLastName("Testowy" + ix);
p.setPesel(new DecimalFormat("0000000").format(ix) + new DecimalFormat("000").format(ix%100));
p.setAge(ix%100);
p = template.postForObject("http://localhost:2222/persons", p, Person.class);
LOGGER.info("New person: {}", p);

p = template.getForObject("http://localhost:2222/persons/{id}", Person.class, p.getId());
p.setAge(ix%100);
template.put("http://localhost:2222/persons", p);
LOGGER.info("Person updated: {} with age={}", p, ix%100);

template.delete("http://localhost:2222/persons/{id}", p.getId());

Now, let’s move back to the step 1. As you probably remember, I have shown you how to run the influx client in the InfluxDB Docker container. After some minutes of working test unit should call exposed endpoints many times. We can check out the values of metric http_server_requests stored on Influx. The following query returns list of measurements collected during last 3 minutes.

actuator-1

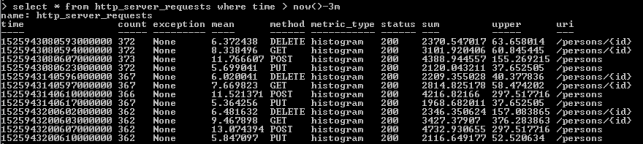
As you see, all the metrics generated by Spring Boot Actuator are tagged with the following information: method, uri, status and exception. Thanks to that tags we may easily group metrics per signle endpoint including failures and success percentage. Let’s see how to configure and view it in Grafana.

5. Metrics visualization using Grafana

Once we have exported succesfully metrics to InfluxDB, it is time to visualize them using Grafana. First, let’s run Docker container with Grafana.

$ docker run -d --name grafana -p 3000:3000 grafana/grafana

Grafana provides user friedly interface for creating influx queries. We define a graph that visualizes requests processing time per each of calling endpoints and total number of requests received by the application. If we filter the statistics stored in the table http_server_requests by method type and uri, we would collect all metrics generated per single endpoint.

actuator-4

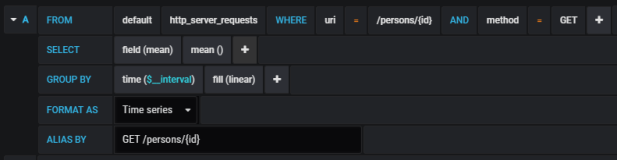
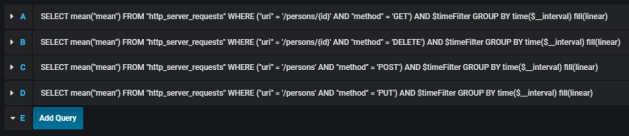
The similar definition should be created for the other endpoints. We will illustrate them all on a single graph.

actuator-5

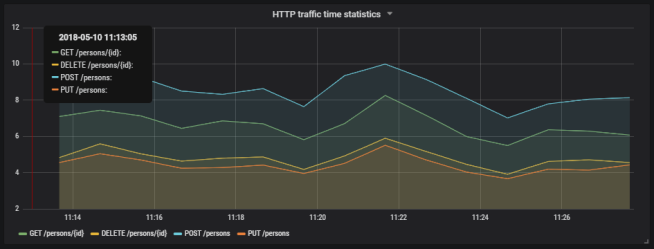
Here’s the final result.

actuator-2

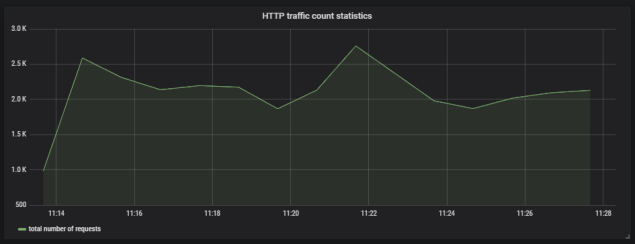
Here’s the graph that visualizes total number of requests sent to the application.

actuator-3

6. Running Prometheus

The most suitable way to run Prometheus locally is obviously through a Docker container. The API is exposed under port 9090. We should also pass the initial configuration file and name of Docker network. Why? You will find all the anwers in the next part of this step description.

docker run -d --name prometheus -p 9090:9090 -v /tmp/prometheus.yml:/etc/prometheus/prometheus.yml --network springboot prom/prometheus

In contrast to InfluxDB, Prometheus pulls metrics from an application. Therefore, we need to enable actuator endpoint that exposes metrics for Prometheus, which is disabled by default. To enable it, set property management.endpoint.prometheus.enabled to true, as shown on the configuration fragment below.

management:
  endpoint:
    prometheus:
	  enabled: true

Then we should set the address of actuator endpoint exposed by the application in Prometheus configuration file. A scrape_config section is responsible for specifying a set of targets and parameters describing how to connect with them. By default, Prometheus tries to collect data from defined target endpoint once a minute.

scrape_configs:
  - job_name: 'springboot'
    metrics_path: '/actuator/prometheus'
    static_configs:
    - targets: ['person-service:2222']

The similar as for integration with InfluxDB we need to include the following artifact to the project’s dependencies.

<dependency>
	<groupId>io.micrometer</groupId>
	<artifactId>micrometer-registry-prometheus</artifactId>
</dependency>

In my case, Docker is running on VM, and is available under IP 192.168.99.100. If I would like Prometheus, which is launched as a Docker container, to be able to connect my application, I also should launch it as Docker container. The most convenient way to link two independent containers is through Docker network. If both containers are assigned to the same network, they would be able to connect to each other using container’s name as a target address. Dockerfile is available in the root directory of the sample application’s source code. Second command visible below (docker build) is not required, because the required image piomin/person-service is available on my Docker Hub repository.

$ docker network create springboot
$ docker build -t piomin/person-service .
$ docker run -d --name person-service -p 2222:2222 --network springboot piomin/person-service

7. Integrate Prometheus with Grafana

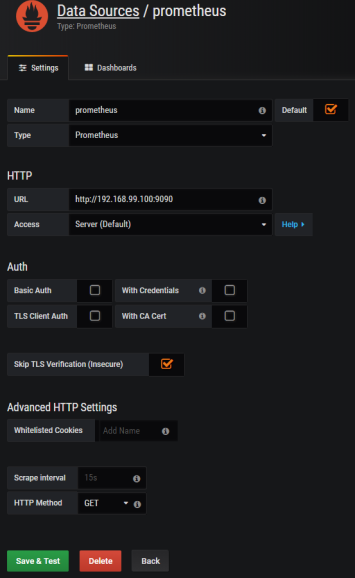
Prometheus exposes web console under address 192.168.99.100:9090, where you can specify query and display graph with metrics. However, we can integrate it with Grafana to take an advantage of nicer visualization offered by this tool. First, you should create Prometheus data source.

actuator-9

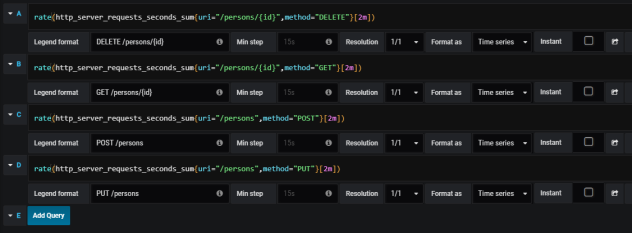
Then we should define queries for collecting metrics from Prometheus API. Spring Boot Actuator exposes three different metrics related to HTTP traffic: http_server_requests_seconds_counthttp_server_requests_seconds_sum and http_server_requests_seconds_max. For example, we may calculate per-second average rate of increase of the time series for http_server_requests_seconds_sum, that returns total number of seconds spent on processing requests by using rate() function. The values can be filtered by method and uri using expression inside {}. The following picture illustrates configuration of rate() function per each endpoint.
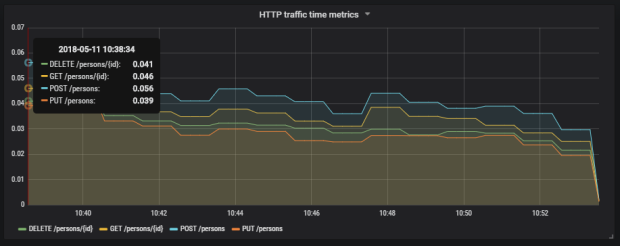
actuator-8

Here’s the graph.

actuator-7

Summary

The improvement in metrics generation between version 1.5 and 2.0 of Spring Boot is significant. Exporting data to such the popular monitoring systems like InfluxDB or Prometheus is now much easier then before, and does not require any additional development. The metrics relating to HTTP traffic are more detailed and they may be easily associated with specific endpoint, thanks to tags indicating the uri, type and status of HTTP request. I think that modifications in Spring Boot Actuator in relation to the previous version of Spring Boot, could be one of the main motivation to migrate your applications to the newest version.

Custom metrics visualization with Grafana and InfluxDB

If you need a solution for querying and visualizing time series and metrics probably your first choice will be Grafana. Grafana is a visualization dashboard and it can collect data from some different databases like MySQL, Elasticsearch and InfluxDB. At present it is becoming very popular to integrate with InfluxDB as a data source. This is a solution specifically designed for storing real-time metrics and events and is very fast and scalable for time-based data. Today, I’m going to show an example Spring Boot application of metrics visualization based on Grafana, InfluxDB and alerts using Slack communicator.

Spring Boot Actuator exposes some endpoint useful for monitoring and interacting with application. It also includes a metrics service with gauge and counter support. Gauge records a single value, counter records incremented or decremented value in all previous steps. The full list of basic metrics is available in Spring Boot documentation here and these are for example free memory, heap usage, datasource pool usage or thread information. We can also define our own custom metrics. To allow exporting such values into InfluxDB we need to declare bean @ExportMetricWriter. Spring Boot has not build-in metrics exporter for InfluxDB, so we have add influxdb-java library into pom.xml dependencies and define connection properties.

	@Bean
	@ExportMetricWriter
	GaugeWriter influxMetricsWriter() {
		InfluxDB influxDB = InfluxDBFactory.connect("http://192.168.99.100:8086", "root", "root");
		String dbName = "grafana";
		influxDB.setDatabase(dbName);
		influxDB.setRetentionPolicy("one_day");
		influxDB.enableBatch(10, 1000, TimeUnit.MILLISECONDS);

		return new GaugeWriter() {

			@Override
			public void set(Metric<?> value) {
				Point point = Point.measurement(value.getName()).time(value.getTimestamp().getTime(), TimeUnit.MILLISECONDS)
						.addField("value", value.getValue()).build();
				influxDB.write(point);
				logger.info("write(" + value.getName() + "): " + value.getValue());
			}
		};
	}

The metrics should be read from Actuator endpoint, so we should declare MetricsEndpointMetricReader bean.

	@Bean
	public MetricsEndpointMetricReader metricsEndpointMetricReader(final MetricsEndpoint metricsEndpoint) {
		return new MetricsEndpointMetricReader(metricsEndpoint);
	}

We can customize exporting process by declaring properties inside application.yml file. In the code fragment below there are two parameters: delay-millis which set metrics export interval to 5 seconds and includes, where we can define which metric should be exported.

spring:
  metrics:
    export:
      delay-millis: 5000
      includes: heap.used,heap.committed,mem,mem.free,threads,datasource.primary.active,datasource.primary.usage,gauge.response.persons,gauge.response.persons.id,gauge.response.persons.remove

To easily run Grafana and InfluxDB let’s use docker.

docker run -d --name grafana -p 3000:3000 grafana/grafana
docker run -d --name influxdb -p 8086:8086 influxdb

Grafana is available under default security credentials admin/admin. The first step is to create InfluxDB data source.

grafana-3
Now, we can create our new dashboard and add some graphs. Before it run Spring Boot sample application to export metrics some data into InfluxDB. Grafana has user friendly support for InfluxDB queries, where you can click the entire configuration and have a hint of syntax. Of course there is also a possibility of writing text queries, but not all of query language features are available.

grafana-4

Here’s the picture with my Grafana dashboard for metrics passed in includes property. On the second picture below you can see enlarged graph with average REST methods processing time.

grafana-1

grafana-2

We can always implement our custom service which generates metrics sent to InfluxDB. Spring Boot Actuator provides two classes for that purpose: CounterService and GaugeService. Below, there is example of GaugeService usage, where the random value between 0 and 100 is generated in 100ms intervals.

@Service
public class FirstService {

    private final GaugeService gaugeService;

    @Autowired
    public FirstService(GaugeService gaugeService) {
        this.gaugeService = gaugeService;
    }

    public void exampleMethod() {
    	Random r = new Random();
    	for (int i = 0; i < 1000000; i++) {
    		this.gaugeService.submit("firstservice", r.nextDouble()*100);
    		try {
			Thread.sleep(100);
			} catch (InterruptedException e) {
				e.printStackTrace();
			}
		}
    }

}

The sample bean FirstService is starting after application startup.

@Component
public class Start implements ApplicationListener<ContextRefreshedEvent> {

	@Autowired
	private FirstService service1;

	@Override
	public void onApplicationEvent(ContextRefreshedEvent contextRefreshedEvent) {
		service1.exampleMethod();
	}

}

Now, let’s configure alert notification using Grafana dashboard and Slack. This feature is available from 4.0 version. I’m going to define a threshold for statistics sent by FirstService bean. If you have already created graph for gauge.firstservice (you need to add this metric name into includes property inside application.yml) go to edit section and then to Alert tab. There you can define alerting condition by selecting aggregating function (for example avg, min, max), evaluation interval and threshold value. For my sample visible in the picture below I selected alerting when maximum value is bigger than 95 and conditions should be evaluated in 5 minute intervals.

grafana-5

After creating alert configuration we should define notification channel. There are some interesting supported notification types like email, Hip Chat, webhook or Slack. When configuring Slack notification we need to pass recipient’s address or channel name and incoming webhook URL. Then, add new notification for your alert sent to Slack in Notifications section.

grafana-6

I created dedicated channel #grafana for Grafana notification on my Slack account and attached incoming webhook to this channel by searching it in Channel Settings -> Add app or integration.

grafana-7

Finally, run my sample application and don’t forget to logout from Grafana Dashboard in case you would like to receive alert on Slack.