A few days ago I came across an article about Spring Boot Admin framework. It is a simple solution created to manage and monitor Spring Boot applications. It is based on endpoints exposed by Spring Boot Actuator. It is worth emphasizing that application only allows monitoring and does not have such capabilities like creating new instances, restarting, so it is not a competition for the solutions like Pivotal Cloud Foundry. More about this solution can be read in my previous article Spring Cloud Microservices at Pivotal Platform. Despite this, Spring Boot Admin seems to be an interesting enough to take a closer look on it.
If you have to manage the system consisting of multiple microservices you need to collect all relevant information in one place. This applies to the logs when we usually use ELK stack (Elasticsearch + Logstash + Kibana), metrics (Zipkin) and details about the status of all application instances, which are running right now. If you are interested in more details about ELK or Zipkin I recommend my previous article Part 2: Creating microservices – monitoring with Spring Cloud Sleuth, ELK and Zipkin.
If you already using Spring Cloud Discovery I’ve got good news for you. Although Spring Boot Admin was created by Codecentric company, it fully integrates with Spring Cloud including the most popular service registration and discovery servers like Zookeeper, Consul and Eureka. It is easy to create your admin server instance. You just have to set up Spring Boot application and add annotation @EnableAdminServer into your main class.
@SpringBootApplication
@EnableDiscoveryClient
@EnableAdminServer
@EnableAutoConfiguration
public class Application {

	public static void main(String[] args) {
		SpringApplication.run(Application.class, args);
	}

}
In the sample application available as usual on GitHub, we enabled discovery from Eureka by adding annotation @EnableDiscoveryClient. There is no need to register admin service in Eureka, because we only need to collect information about all registered microservices. There is also a possibility to include Spring Boot Admin to your Eureka server instance, but admin context should be changed (property spring.boot.admin.context-path) to prevent clash with Eureka UI. Here’s application.yml configuration file for the sample with independent admin service.
eureka:
  client:
    registryFetchIntervalSeconds: 5
    registerWithEureka: false
    serviceUrl:
      defaultZone: ${DISCOVERY_URL:http://localhost:8761}/eureka/
  instance:
    leaseRenewalIntervalInSeconds: 10

management:
  security:
    enabled: false
Here is the list of dependencies included in pom.xml.
<dependencies>
	<dependency>
		<groupId>org.springframework.cloud</groupId>
		<artifactId>spring-cloud-starter-eureka</artifactId>
	</dependency>
	<dependency>
		<groupId>de.codecentric</groupId>
		<artifactId>spring-boot-admin-server</artifactId>
		<version>1.5.1</version>
	</dependency>
	<dependency>
		<groupId>de.codecentric</groupId>
		<artifactId>spring-boot-admin-server-ui</artifactId>
		<version>1.5.1</version>
	</dependency>
</dependencies>
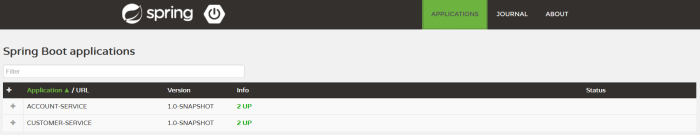
Now you only need to build and run your server with java -jar admin-service.jar. UI dashboard is available under http://localhost:8080 as you on the figure below. Services are grouped by name and there is information how many instances of each microservice is running.
On the client side we have to add those two dependencies below. Spring Boot Actuator is required as a mentioned before, Jolokia library is used for more advanced features like JMX mbeans and log level management.
<dependency>
	<groupId>org.springframework.boot</groupId>
	<artifactId>spring-boot-starter-actuator</artifactId>
</dependency>
<dependency>
	<groupId>org.jolokia</groupId>
	<artifactId>jolokia-core</artifactId>
</dependency>
To display information visible in the figure below like version, Git commit details below for each application we need to add two maven plugins into pom.xml. First of them will generate build-info.properties file with most important application info. Second includes git.properties file with all information about last commit. Result are available under Spring Boot Actuator info endpoint.
<plugin>
	<groupId>org.springframework.boot</groupId>
	<artifactId>spring-boot-maven-plugin</artifactId>
	<configuration>
		<mainClass>pl.piomin.microservices.account.Application</mainClass>
		<addResources>true</addResources>
	</configuration>
	<executions>
		<execution>
			<goals>
				<goal>build-info</goal>
				<goal>repackage</goal>
			</goals>
			<configuration>
				<additionalProperties>
					<java.target>${maven.compiler.target}</java.target>
					<time>${maven.build.timestamp}</time>
				</additionalProperties>
			</configuration>
		</execution>
	</executions>
</plugin>
<plugin>
	<groupId>pl.project13.maven</groupId>
	<artifactId>git-commit-id-plugin</artifactId>
	<configuration>
		<failOnNoGitDirectory>false</failOnNoGitDirectory>
	</configuration>
</plugin>
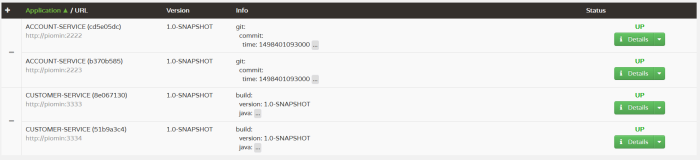
I created two microservices in the sample application account-service and customer-service. Run some instances of them on different ports with command java -jar -DPORT=[port] [service-name].jar. Information visible in Version and Info columns is taken from build-info.properties and git.properties files.
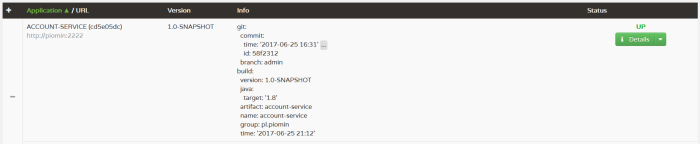
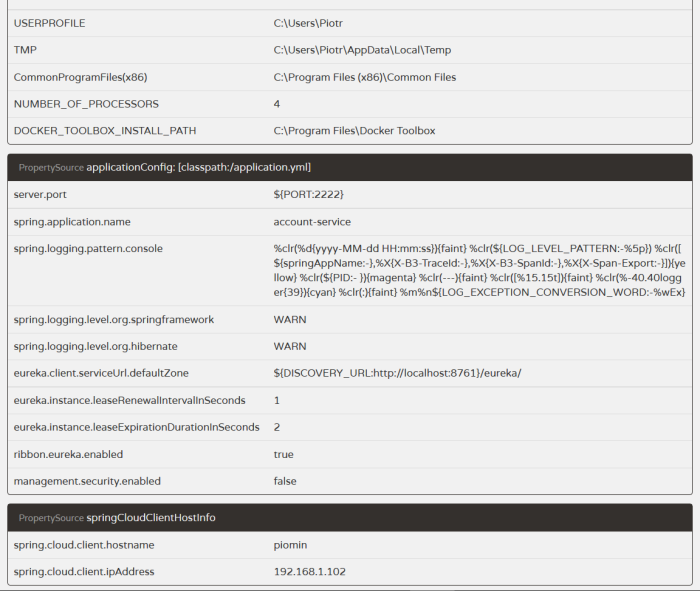
Here’s full list of parameters for account-service.
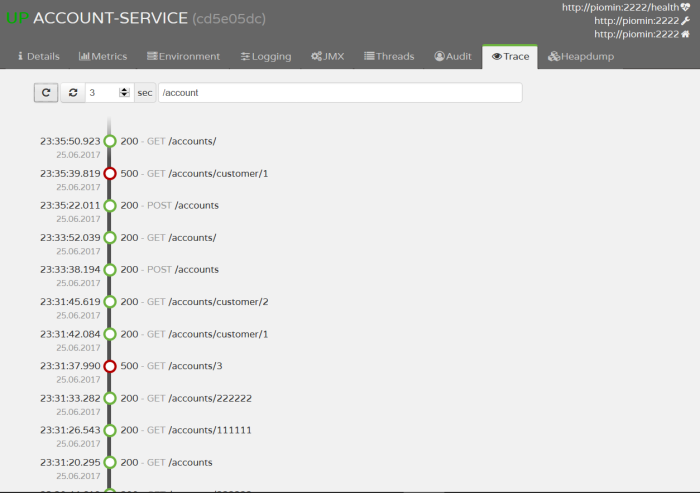
There also some other interesting features offered by Spring Boot Admin. In the Trace section we can browse HTTP requestes and responses history with date, status and method information. It could be filtered by path fragment.
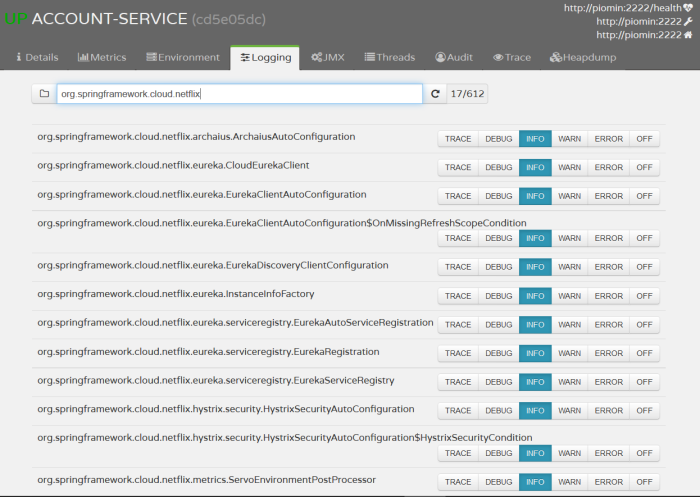
By adding Jolokia dependency we are able to view and change log level for every category in the Logging section.
We can collect configuration details for every instance of microservice.
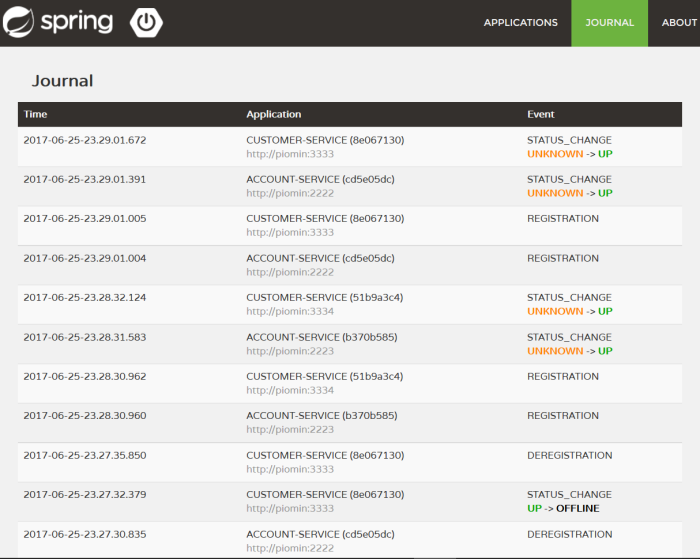
In the Journal tab there is list of status changes for all services monitored by Spring Boot Admin.
Conclusion
Spring Boot Admin is an excellent tool for visualizing endpoints exposed by Spring Boot Actuator with healhchecks and application details. It has easy integration with Spring Cloud and can group all running instances of microservice by its name taken from Eureka (or some other registration and discovery servers) registry. However, I see a lack of the possibility for remote application restart. I think it would be quite easy to implement using a tool such as Ansible and the information displayed by the Spring Boot Actuator endpoints.

Did you try with Spring Boot Admin with Consul hosted on Https?
LikeLike
Hey there , thats some nice info , i had a question if you were able to register any https applications running ?? let it be eureka or consul?? Would be great if you could help me out in this.Thanks
LikeLike
Yes, I’m able. First you need to generate self-signed certificate, for example using keytool.
And then enable https for Spring Boot app and for Eureka client.
server:

  port: ${PORT:8081}

  ssl:

    key-store: classpath:keystore.p12

    key-store-password: 123456

    keyStoreType: PKCS12

    keyAlias: client
eureka:
client:
serviceUrl:
defaultZone: ${EUREKA_URL:http://localhost:8761/eureka/}
instance:
securePortEnabled: true
nonSecurePortEnabled: false
statusPageUrl: https://${eureka.hostname}:${server.port}/info
healthCheckUrl: https://${eureka.hostname}:${server.port}/health
homePageUrl: https://${eureka.hostname}:${server.port}/
You can take a look on that example https://github.com/piomin/sample-spring-cloud-netflix.git, branch secure_client.
LikeLiked by 1 person
thanks , do you have any sample application over https??
LikeLike
My question was were you able to see any applications registered on spring boot admin which were over https??
LikeLike
Well, spring boot admin fetches data from service discovery, right? So, you should see
LikeLiked by 1 person
ok , do you have any sample application atleast with git-hub that i could refer?? Would appreciate it if you would
LikeLike
Git repo here https://github.com/piomin/sample-spring-microservices/tree/admin
LikeLike