One of the most frequently mentioned challenges related to the creation of microservices based architecture is monitoring. Each microservice should be run on an environment isolated from the other microservices, so it does not share resources such as databases or log files with them. However, the essential requirement for microservices architecture is relatively easy to access the call history, including the ability to look through the request propagation between multiple microservices. Grepping the logs is not the right solution for that problem. There are some helpful tools which can be used when creating microservices with Spring Boot and Spring Cloud frameworks.
Spring Cloud Sleuth – library available as a part of Spring Cloud project. Lets you track the progress of subsequent microservices by adding the appropriate headers to the HTTP requests. The library is based on the MDC (Mapped Diagnostic Context) concept, where you can easily extract values put to context and display them in the logs.
Zipkin – distributed tracing system that helps to gather timing data for every request propagated between independent services. It has simple management console where we can find visualization of the time statistics generated by subsequent services.
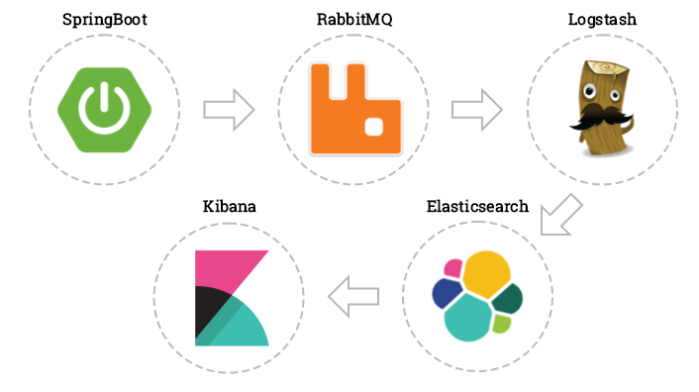
ELK – Elasticsearch, Logstash, Kibana: three different tools usually used together. They are used for searching, analyzing, and visualizing log data in a real time.
Probably many of you, even if you have not had a touch with Java or microservices before, heard about Logstash and Kibana. For example, if you look at the hub.docker.com among the most popular images you will find the ones for the above tools. In our example, we will just use those images. Let’s begin from running container with Elasticsearch.
docker run -d -it --name es -p 9200:9200 -p 9300:9300 elasticsearch
The we can run Kibana container and link it to the Elasticsearch.
docker run -d -it --name kibana --link es:elasticsearch -p 5601:5601 kibana
At the end we will start Logstash with input and output declared. As an input we declare TCP which is compatible with LogstashTcpSocketAppender used as a logging appender in our sample application. As an output elasticsearch has been declared. Each microservice will be indexed on its name with micro prefix.
docker run -d -it --name logstash -p 5000:5000 logstash -e 'input { tcp { port => 5000 codec => "json" } } output { elasticsearch { hosts => ["192.168.99.100"] index => "micro-%{serviceName}"} }'
Now we can take a look on sample microservices. This post is a continuation of my previous article Part 1: Creating microservice using Spring Cloud, Eureka and Zuul. Architecture and exposed services are the same as in the previous sample. Source code is available on GitHub (branch logstash). Like a mentioned before we will use Logback library for sending log data to Logstash. In addition to the three Logback dependencies we also add libraries for Zipkin integration and Spring Cloud Sleuth starter. Here’s fragment of pom.xml for microservice.
		<dependency>
			<groupId>org.springframework.cloud</groupId>
			<artifactId>spring-cloud-starter-sleuth</artifactId>
		</dependency>
		<dependency>
			<groupId>org.springframework.cloud</groupId>
			<artifactId>spring-cloud-sleuth-zipkin</artifactId>
		</dependency>
		<dependency>
			<groupId>net.logstash.logback</groupId>
			<artifactId>logstash-logback-encoder</artifactId>
			<version>4.9</version>
		</dependency>
		<dependency>
			<groupId>ch.qos.logback</groupId>
			<artifactId>logback-classic</artifactId>
			<version>1.2.3</version>
		</dependency>
		<dependency>
			<groupId>ch.qos.logback</groupId>
			<artifactId>logback-core</artifactId>
			<version>1.2.3</version>
		</dependency>
There is also Logback configuration file in src/main/resources directory. Here’s logback.xml fragment. We can configure which logging field are sending to Logstash by declaring tags mdc, logLevel, message etc. We are also appending service name field for elasticsearch index creation.
	<appender name="STASH" class="net.logstash.logback.appender.LogstashTcpSocketAppender">
		<destination>192.168.99.100:5000</destination>

		<encoder class="net.logstash.logback.encoder.LoggingEventCompositeJsonEncoder">
			<providers>
				<mdc />
				<context />
				<logLevel />
				<loggerName />

				<pattern>
					<pattern>
						{
						"serviceName": "account-service"
						}
					</pattern>
				</pattern>

				<threadName />
				<message />
				<logstashMarkers />
				<stackTrace />
			</providers>
		</encoder>
	</appender>
The configuration of Spring Cloud Sleuth is very simple. We only have to add spring-cloud-starter-sleuth dependency to pom.xml and declare sampler @Bean . In the sample I declared AlwaysSampler that exports every span, but there is also an other other option – PercentageBasedSampler that samples a fixed fraction of spans.
	@Bean
	public AlwaysSampler defaultSampler() {
	  return new AlwaysSampler();
	}
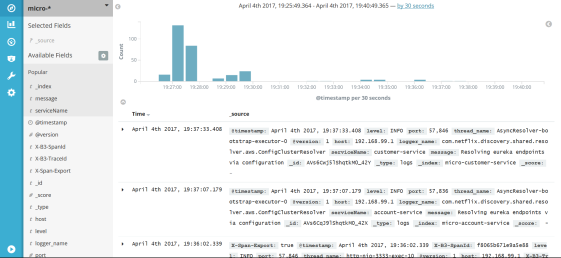
After starting ELK docker containers we need to run our microservices. There are 5 Spring Boot applications which need to be run discovery-service, account-service, customer-service, gateway-service and zipkin-service. After launching all of them we can try call some services, for example http://localhost:8765/api/customer/customers/{id}, which causes calling of both customer and account service. All logs will be stored in elasticsearch with micro-%{serviceName} index. They can be searched in Kibana with micro-* index pattern. Index patterns are created in Kibana under section Management -> Index patterns. Kibana is available under address http://192.168.99.100:5601. After first running we will be prompt for index pattern, so let’s type micro-*. Under Discover section we can take o look on all logs matched typed pattern with timeline visualization.
Kibana is rather intuitive and user friendly tool. I will not describe in the details how to use Kibana, because you can easily find it out by yourself reading a documentation or just clicking UI. The most important thing is to be able to search a logs by filtering criteria. In the picture below there is an example of searching logs by X-B3-TraceId field, which is add to the request header by Spring Cloud Sleuth. Sleuth also adds X-B3-SpanId for marking request for single microservice. We can select which field are displayed in the result list – in this sample I selected message and serviceName like you see in the left pane of the picture.
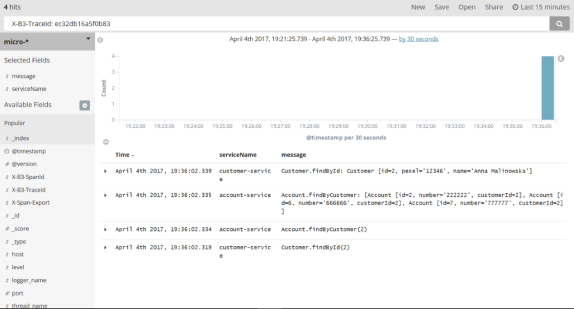
Here’s a picture with single request details. It is visible after expanding each log row.

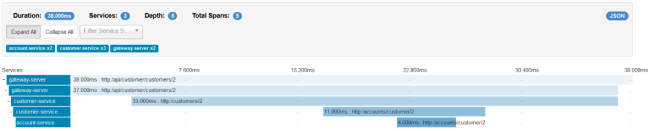
Spring Cloud Sleuth also sends statistics to Zipkin. That is another kind of data than is stored in Logstash. These are timing statistics for each request. Zipkin UI is really simple. You can filter the requests by some criteria like time, service name, endpoint name. Here’s picture with same requests which were visualized with Kibana: http://localhost:8765/api/customer/customers/{id}.
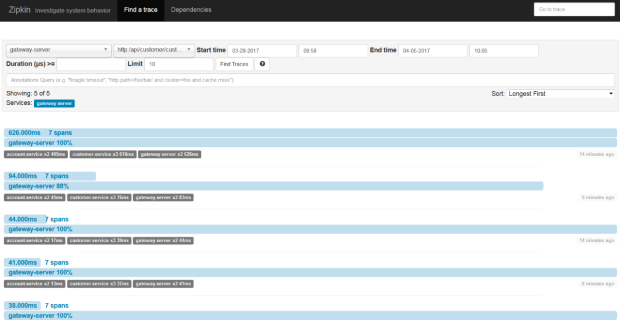
We can always see the details of each request by clicking on it. Then you see the picture similar to visible below. In the beginning, the request has been processed on API gateway. Then gateway discovered customer service on Eureka server and called that service. Customer service also has to discover account service and then call it. In this view you can easily find out which operation is the most time consuming.