Continuous Delivery with OpenShift and Jenkins: A/B Testing

One of the reason you could decide to use OpenShift instead of some other containerized platforms (for example Kubernetes) is out-of-the-box support for continuous delivery pipelines. Without proper tools the process of releasing software in your organization may be really time-consuming and painful. The quickness of that process becoming especially important if you deliver software to production frequently. Currently, the most popular use case for it is microservices-based architecture, where you have many small, independent applications.

Continue reading “Continuous Delivery with OpenShift and Jenkins: A/B Testing”

Running Jenkins Server with Configuration-As-Code

Some days ago I came across a newly created Jenkins plugin called Configuration as Code (JcasC). This plugin allows you to define Jenkins configuration in very popular format these days – YAML notation. It is interesting that such a plugin has not been created before, but better late than never. Of course, we could have use some other Jenkins plugins for that, like Job DSL Plugin, but it is based on Groovy language.
If you have any experience with Jenkins, you probably know how many plugins and other configuration settings it requires to have in order to work in your organization as a main CI server. With JcasC plugin, you can store such a configuration in human-readable declarative YAML files. In this article I’m going to show you how to create and run Jenkins with configuration as code letting you to build Java application using such tools like declarative pipelines, Git, Maven. I’ll also show how to manage sensitive data using Vault server.

1. Using Vault server

We will begin from running Vault server on the local machine. The easiest way to do that is with Docker image. By default, official Vault image is started in development mode. The following command runs an in-memory server, which listens on address 0.0.0.0:8200

docker run -d --name=vault --cap-add=IPC_LOCK -p 8200:8200 vault:0.9.0

There is one thing that should be clarified here. I do not run the newest version of Vault, because it forces us to call endpoints from version 2 of KV (Key-Value Secrets Engine) HTTP API, which is used for manipulating secrets. This version, in turn, is not supported by JcasC plugin that can communicate only with endpoints from version 1 of KV HTTP API. It does not apply to older version of Vault, for example 0.9.0, which allows to call KV in version 1. After running container we should obtain the token used for authentication against Vault from the console logs. To do that just run command docker logs vault and find the following fragment in the logs.

vault-token
Now, using this authentication token we may add credentials required for accessing Jenkins web dashboard and our account on Git repository host. Jenkins account will be identified by rootPassword key, while GitHub account by githubPassword key.

$ curl -H "X-Vault-Token:  5bcab13b-6cf5-2f58-8b37-34dca31bebde" --request POST -d '{"rootPassword":"your_root_password", "githubPassword":"your_github_password"}' https://192.168.99.100:8200/v1/secret/jenkins

To check out if the parameters has been saved on Vault just call GET method with the same context path.

$ curl -H "X-Vault-Token:  5bcab13b-6cf5-2f58-8b37-34dca31bebde" https://192.168.99.100:8200/v1/secret/jenkins

2. Building Jenkins image

The same as for Vault server we also run Jenkins on Docker container. However, we need to add some configuration settings to Jenkins official image before running it. JcasC plugin requires setting an environment variable that points to location of the current YAML configuration files. This variable can point to the following:

  • Path to a folder containing a set of config files
  • A full path to a single file
  • A URL pointing to a file served on the web, or for example your internal configuration server

The next step is to set some configuration settings required for establishing connection to Vault server. We have to pass the authentication token, the path of created key and the URL of running server. All these configuration settings are set as environment variables and may be overridden on container startup. The same rule applies to the location of JcasC configuration file. The following Dockerfile definition extends Jenkins base image, and add all the required parameters for running it using JcasC plugin and with secrets taken from Vault.

FROM jenkins/jenkins:lts
ENV CASC_JENKINS_CONFIG="/var/jenkins_home/jenkins.yml"
ENV CASC_VAULT_TOKEN=5bcab13b-6cf5-2f58-8b37-34dca31bebde
ENV CASC_VAULT_PATH=/secret/jenkins
ENV CASC_VAULT_URL=http://192.168.99.100:8200
COPY jenkins.yml ${CASC_JENKINS_CONFIG}
USER jenkins
RUN /usr/local/bin/install-plugins.sh configuration-as-code configuration-as-code-support git workflow-cps-global-lib

Now, let’s build the Docker image using Dockerfile visible above. Alternatively, you can just pull the image stored in my Docker Hub repository.

$ docker build -t piomin/jenkins-casc:1.0 .

Finally, you can run the container based on the built image with the following command. Of course, before that we need to prepare the YAML configuration file for JcasC plugin.

$ docker run -d --name jenkins-casc -p 8080:8080 -p 50000:50000 piomin/jenkins-casc:1.0 .

3. Preparing configuration

JcasC plugin provides many configuration settings that allows you to configure various components of your jenkins master installation. However, I will limit myself to defining the basic configuration used for building my sample Java application. We need the following Jenkins components to be configured after startup:

  1. A set of Jenkins plugins allowing to create declarative pipeline that checkouts source code from Git repository, builds it using Maven, and records JUnit test results
  2. Basic security realm containing credentials for a single Jenkins user. The user password is read from property rootPassword stored on Vault server
  3. JDK location directory
  4. Maven installation settings – Maven is not installed by default in Jenkins, so we have to set required version and tool name
  5. Credentials for accessing Git repository containing application source code
plugins: # (1)
  required:
    git: 3.9.1
    pipeline-model-definition: 1.3.2
    pipeline-stage-step: 2.3
    pipeline-maven: 3.5.12
    workflow-aggregator: 2.5
    junit: 1.25
  sites:
  - id: "default"
    url: "https://updates.jenkins.io/update-center.json"
jenkins:
  agentProtocols:
  - "JNLP4-connect"
  - "Ping"
  authorizationStrategy:
    loggedInUsersCanDoAnything:
      allowAnonymousRead: false
  crumbIssuer:
    standard:
      excludeClientIPFromCrumb: false
  disableRememberMe: false
  mode: NORMAL
  numExecutors: 2
  primaryView:
    all:
      name: "all"
  quietPeriod: 5
  scmCheckoutRetryCount: 0
  securityRealm: # (2)
    local:
      allowsSignup: false
      enableCaptcha: false
      users:
      - id: "piomin"
        password: ${rootPassword}
  slaveAgentPort: 50000
  views:
  - all:
      name: "all"
tool:
  git:
    installations:
    - home: "git"
      name: "Default"
  jdk: # (3)
    installations:
    - home: "/docker-java-home"
      name: "jdk"
  maven: # (4)
    installations:
    - name: "maven"
      properties:
      - installSource:
          installers:
          - maven:
              id: "3.5.4"
credentials: # (5)
  system:
    domainCredentials:
      - domain :
          name: "github.com"
          description: "GitHub"
        credentials:
          - usernamePassword:
              scope: SYSTEM
              id: github-piomin
              username: piomin
              password: ${githubPassword}

4. Exporting configuration

After running Jenkins with JcasC plugin installed you can easily export the current configuration to the file. First, navigate to section Manage Jenkins -> Configuration as Code.

jcasc-1

Then, after choosing Export Configuration button, the YAML file with Jenkins configuration will be downloaded to your machine. But following the comment visible below you cannot rely on that file, because this feature is still not stable. For my configuration it didn’t export Maven tool settings and list of Jenkins plugins. However, the JcasC plugin is probably still under active development, so I hope that feature will work succesfully soon.

jcasc-2

5. Running sample pipeline

Finally you can create and run pipeline for your sample application. Here’s the definition of my pipeline.

pipeline {
    agent any
    tools {
        maven 'maven'
    }
    stages {
        stage('Checkout') {
            steps {
                git url: 'https://github.com/piomin/sample-spring-boot-autoscaler.git', credentialsId: 'github-piomin', branch: 'master'
            }
        }
		stage('Test') {
            steps {
                dir('example-service') {
                    sh 'mvn clean test'
                }
            }
        }
        stage('Build') {
            steps {
                dir('example-service') {
                    sh 'mvn clean install'
                }
            }
        }
    }
    post {
        always {
            junit '**/target/reports/**/*.xml'
        }
    }
}

Summary

The idea around Jenkins Configuration as Code Plugin is the step in the right direction. I’ll be following the development of this product with the great interest. There are still some features that needs to be added to make it more useful, and some bugs that need to be fixed. But after that I’ll will definitely consider using this plugin for maintaining the current Jenkins master server inside my organization.

Continuous Integration with Jenkins, Artifactory and Spring Cloud Contract

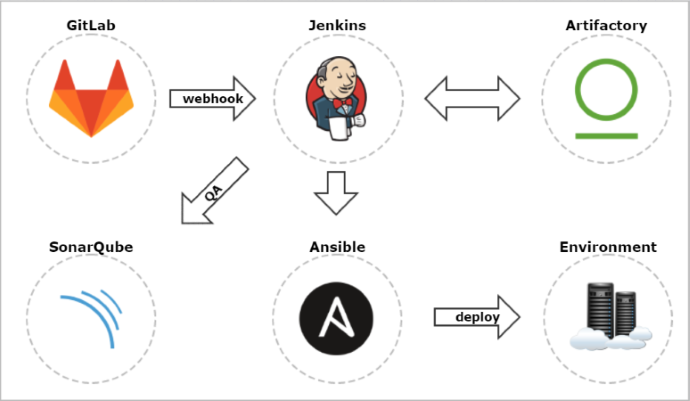
Consumer Driven Contract (CDC) testing is one of the method that allows you to verify integration between applications within your system. The number of such interactions may be really large especially if you maintain microservices-based architecture. Assuming that every microservice is developed by different teams or sometimes even different vendors, it is important to automate the whole testing process. As usual, we can use Jenkins server for running contract tests within our Continuous Integration (CI) process.

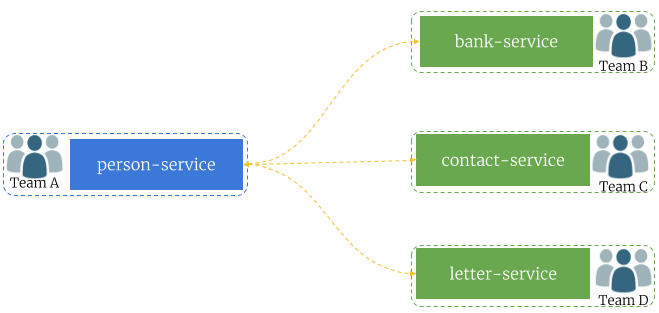
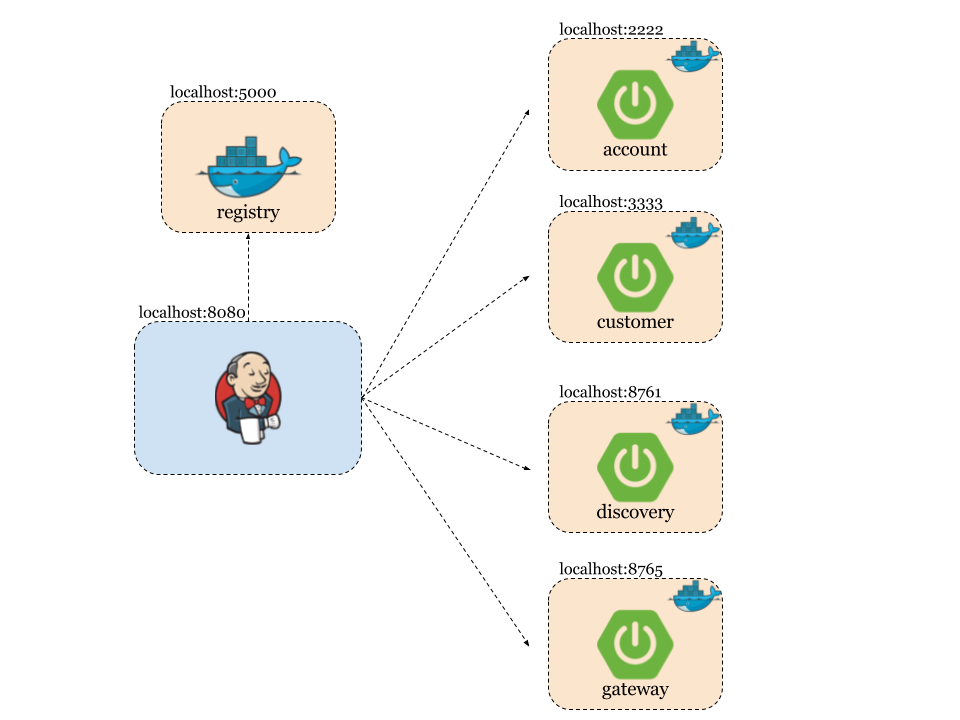
The sample scenario has been visualized on the picture below. We have one application (person-service) that exposes API leveraged by three different applications. Each application is implementing by a different development team. Consequently, every application is stored in the separated Git repository and has dedicated pipeline in Jenkins for building, testing and deploying.

contracts-3 (1)

The source code of sample applications is available on GitHub in the repository sample-spring-cloud-contract-ci (https://github.com/piomin/sample-spring-cloud-contract-ci.git). I placed all the sample microservices in the single Git repository only for our demo simplification. We will still treat them as a separated microservices, developed and built independently.

In this article I used Spring Cloud Contract for CDC implementation. It is the first choice solution for JVM applications written in Spring Boot. Contracts can be defined using Groovy or YAML notation. After building on the producer side Spring Cloud Contract generate special JAR file with stubs suffix, that contains all defined contracts and JSON mappings. Such a JAR file can be build on Jenkins and then published on Artifactory. Contract consumer also use the same Artifactory server, so they can use the latest version of stubs file. Because every application expects different response from person-service, we have to define three different contracts between person-service and a target consumer.

contracts-1

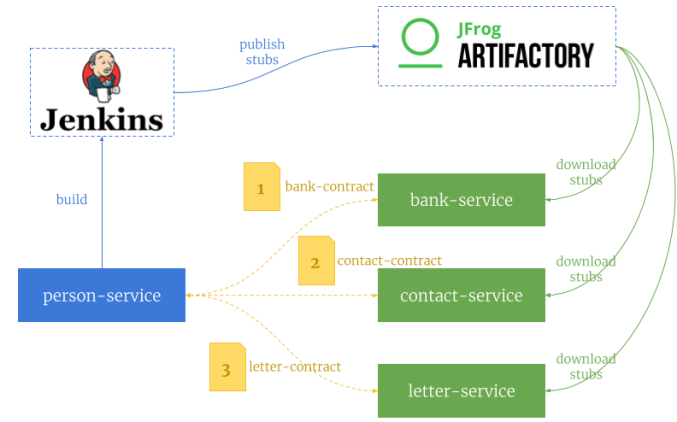
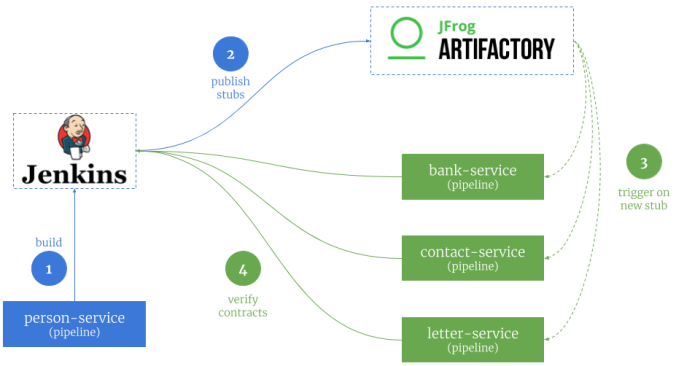
Let’s analyze the sample scenario. Assuming we have performed some changes in the API exposed by person-service and we have modified contracts on the producer side, we would like to publish them on shared server. First, we need to verify contracts against producer (1), and in case of success publish artifact with stubs to Artifactory (2). All the pipelines defined for applications that use this contract are able to trigger the build on a new version of JAR file with stubs (3). Then, the newest version contract is verifying against consumer (4). If contract testing fails, pipeline is able to notify the responsible team about this failure.

contracts-2

1. Pre-requirements

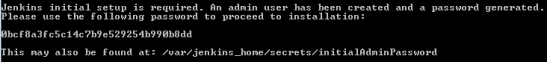
Before implementing and running any sample we need to prepare our environment. We need to launch Jenkins and Artifactory servers on the local machine. The most suitable way for this is through a Docker containers. Here are the commands required for run these containers.

$ docker run --name artifactory -d -p 8081:8081 docker.bintray.io/jfrog/artifactory-oss:latest
$ docker run --name jenkins -d -p 8080:8080 -p 50000:50000 jenkins/jenkins:lts

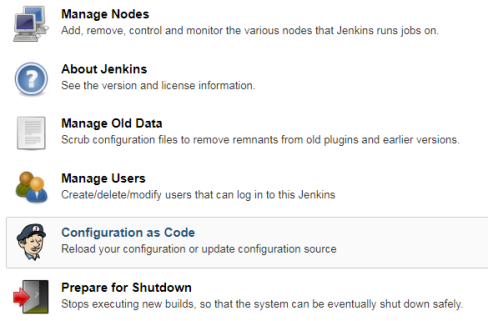
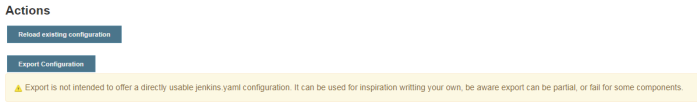
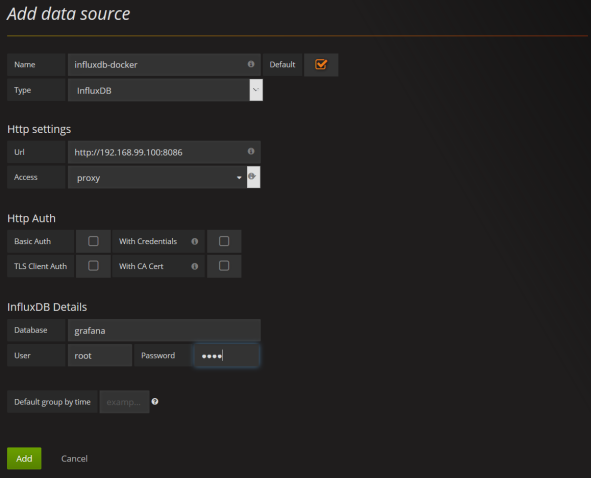
I don’t know if you are familiar with such tools like Artifactory and Jenkins. But after starting them we need to configure some things. First you need to initialize Maven repositories for Artifactory. You will be prompt for that just after a first launch. It also automatically add one remote repository: JCenter Bintray (https://bintray.com/bintray/jcenter), which is enough for our build. Jenkins also comes with default set of plugins, which you can install just after first launch (Install suggested plugins). For this demo, you will also have to install plugin for integration with Artifactory (https://wiki.jenkins.io/display/JENKINS/Artifactory+Plugin). If you need more details about Jenkins and Artifactory configuration you can refer to my older article How to setup Continuous Delivery environment.

2. Building contracts

We are beginning contract definition from the producer side application. Producer exposes only one GET /persons/{id} method that returns Person object. Here are the fields contained by Person class.

public class Person {

	private Integer id;
	private String firstName;
	private String lastName;
	@JsonFormat(pattern = "yyyy-MM-dd")
	private Date birthDate;
	private Gender gender;
	private Contact contact;
	private Address address;
	private String accountNo;

	// ...
}

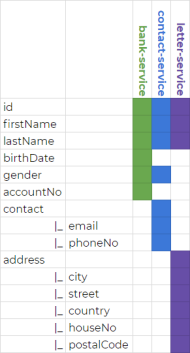
The following picture illustrates, which fields of Person object are used by consumers. As you see, some of the fields are shared between consumers, while some other are required only by single consuming application.

contracts-4

Now we can take a look on contract definition between person-service and bank-service.

import org.springframework.cloud.contract.spec.Contract

Contract.make {
	request {
		method 'GET'
		urlPath('/persons/1')
	}
	response {
		status OK()
		body([
			id: 1,
			firstName: 'Piotr',
			lastName: 'Minkowski',
			gender: $(regex('(MALE|FEMALE)')),
			contact: ([
				email: $(regex(email())),
				phoneNo: $(regex('[0-9]{9}$'))
			])
		])
		headers {
			contentType(applicationJson())
		}
	}
}

For comparison, here’s definition of contract between person-service and letter-service.

import org.springframework.cloud.contract.spec.Contract

Contract.make {
	request {
		method 'GET'
		urlPath('/persons/1')
	}
	response {
		status OK()
		body([
			id: 1,
			firstName: 'Piotr',
			lastName: 'Minkowski',
			address: ([
				city: $(regex(alphaNumeric())),
				country: $(regex(alphaNumeric())),
				postalCode: $(regex('[0-9]{2}-[0-9]{3}')),
				houseNo: $(regex(positiveInt())),
				street: $(regex(nonEmpty()))
			])
		])
		headers {
			contentType(applicationJson())
		}
	}
}

3. Implementing tests on the producer side

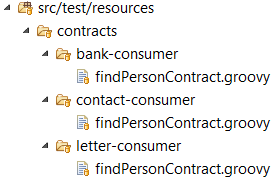
Ok, we have three different contracts assigned to the single endpoint exposed by person-service. We need to publish them in such a way to that they are easily available for consumers. In that case Spring Cloud Contract comes with a handy solution. We may define contracts with different response for the same request, and than choose the appropriate definition on the consumer side. All those contract definitions will be published within the same JAR file. Because we have three consumers we define three different contracts placed in directories bank-consumer, contact-consumer and letter-consumer.

contracts-5

All the contracts will use a single base test class. To achieve it we need to provide a fully qualified name of that class for Spring Cloud Contract Verifier plugin in pom.xml.

<plugin>
	<groupId>org.springframework.cloud</groupId>
	<artifactId>spring-cloud-contract-maven-plugin</artifactId>
	<extensions>true</extensions>
	<configuration>
		<baseClassForTests>pl.piomin.services.person.BasePersonContractTest</baseClassForTests>
	</configuration>
</plugin>

Here’s the full definition of base class for our contract tests. We will mock the repository bean with the answer matching to the rules created inside contract files.

@RunWith(SpringRunner.class)
@SpringBootTest(webEnvironment = WebEnvironment.DEFINED_PORT)
public abstract class BasePersonContractTest {

	@Autowired
	WebApplicationContext context;
	@MockBean
	PersonRepository repository;
	
	@Before
	public void setup() {
		RestAssuredMockMvc.webAppContextSetup(this.context);
		PersonBuilder builder = new PersonBuilder()
			.withId(1)
			.withFirstName("Piotr")
			.withLastName("Minkowski")
			.withBirthDate(new Date())
			.withAccountNo("1234567890")
			.withGender(Gender.MALE)
			.withPhoneNo("500070935")
			.withCity("Warsaw")
			.withCountry("Poland")
			.withHouseNo(200)
			.withStreet("Al. Jerozolimskie")
			.withEmail("piotr.minkowski@gmail.com")
			.withPostalCode("02-660");
		when(repository.findById(1)).thenReturn(builder.build());
	}
	
}

Spring Cloud Contract Maven plugin visible above is responsible for generating stubs from contract definitions. It is executed during Maven build after running mvn clean install command. The build is performed on Jenkins CI. Jenkins pipeline is responsible for updating remote Git repository, build binaries from source code, running automated tests and finally publishing JAR file containing stubs on a remote artifact repository – Artifactory. Here’s Jenkins pipeline created for the contract producer side (person-service).

node {
  withMaven(maven:'M3') {
    stage('Checkout') {
      git url: 'https://github.com/piomin/sample-spring-cloud-contract-ci.git', credentialsId: 'piomin-github', branch: 'master'
    }
    stage('Publish') {
      def server = Artifactory.server 'artifactory'
      def rtMaven = Artifactory.newMavenBuild()
      rtMaven.tool = 'M3'
      rtMaven.resolver server: server, releaseRepo: 'libs-release', snapshotRepo: 'libs-snapshot'
      rtMaven.deployer server: server, releaseRepo: 'libs-release-local', snapshotRepo: 'libs-snapshot-local'
      rtMaven.deployer.artifactDeploymentPatterns.addInclude("*stubs*")
      def buildInfo = rtMaven.run pom: 'person-service/pom.xml', goals: 'clean install'
      rtMaven.deployer.deployArtifacts buildInfo
      server.publishBuildInfo buildInfo
    }
  }
}

We also need to include dependency spring-cloud-starter-contract-verifier to the producer app to enable Spring Cloud Contract Verifier.

<dependency>
	<groupId>org.springframework.cloud</groupId>
	<artifactId>spring-cloud-starter-contract-verifier</artifactId>
	<scope>test</scope>
</dependency>

4. Implementing tests on the consumer side

To enable Spring Cloud Contract on the consumer side we need to include artifact spring-cloud-starter-contract-stub-runner to the project dependencies.

<dependency>
	<groupId>org.springframework.cloud</groupId>
	<artifactId>spring-cloud-starter-contract-stub-runner</artifactId>
	<scope>test</scope>
</dependency>

Then, the only thing left is to build JUnit test, which verifies our contract by calling it through OpenFeign client. The configuration of that test is provided inside annotation @AutoConfigureStubRunner. We select the latest version of person-service stubs artifact by setting + in the version section of ids parameter. Because, we have multiple contracts defined inside person-service we need to choose the right for current service by setting consumer-name parameter. All the contract definitions are downloaded from Artifactory server, so we set stubsMode parameter to REMOTE. The address of Artifactory server has to be set using repositoryRoot property.

@RunWith(SpringRunner.class)
@SpringBootTest(webEnvironment = WebEnvironment.NONE)
@AutoConfigureStubRunner(ids = {"pl.piomin.services:person-service:+:stubs:8090"}, consumerName = "letter-consumer",  stubsPerConsumer = true, stubsMode = StubsMode.REMOTE, repositoryRoot = "http://192.168.99.100:8081/artifactory/libs-snapshot-local")
@DirtiesContext
public class PersonConsumerContractTest {

	@Autowired
	private PersonClient personClient;
	
	@Test
	public void verifyPerson() {
		Person p = personClient.findPersonById(1);
		Assert.assertNotNull(p);
		Assert.assertEquals(1, p.getId().intValue());
		Assert.assertNotNull(p.getFirstName());
		Assert.assertNotNull(p.getLastName());
		Assert.assertNotNull(p.getAddress());
		Assert.assertNotNull(p.getAddress().getCity());
		Assert.assertNotNull(p.getAddress().getCountry());
		Assert.assertNotNull(p.getAddress().getPostalCode());
		Assert.assertNotNull(p.getAddress().getStreet());
		Assert.assertNotEquals(0, p.getAddress().getHouseNo());
	}
	
}

Here’s Feign client implementation responsible for calling endpoint exposed by person-service

@FeignClient("person-service")
public interface PersonClient {

	@GetMapping("/persons/{id}")
	Person findPersonById(@PathVariable("id") Integer id);
	
}

5. Setup of Continuous Integration process

Ok, we have already defined all the contracts required for our exercise. We have also build a pipeline responsible for building and publishing stubs with contracts on the producer side (person-service). It always publish the newest version of stubs generated from source code. Now, our goal is to launch pipelines defined for three consumer applications, each time when new stubs would be published to Artifactory server by producer pipeline.
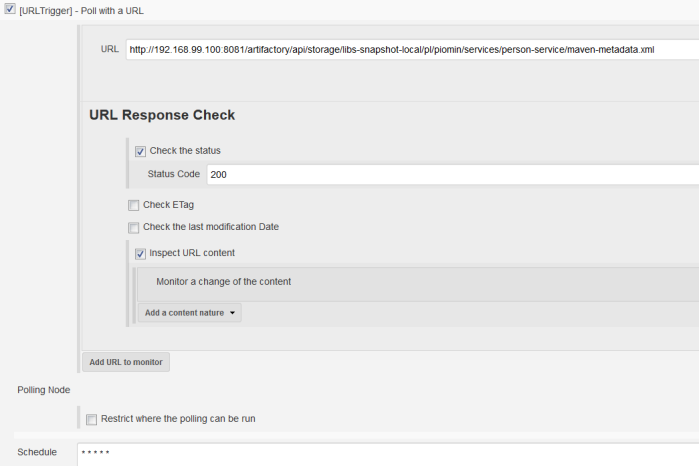
The best solution for that would be to trigger a Jenkins build when you deploy an artifact. To achieve it we use Jenkins plugin called URLTrigger, that can be configured to watch for changes on a certain URL, in that case REST API endpoint exposed by Artifactory for selected repository path.
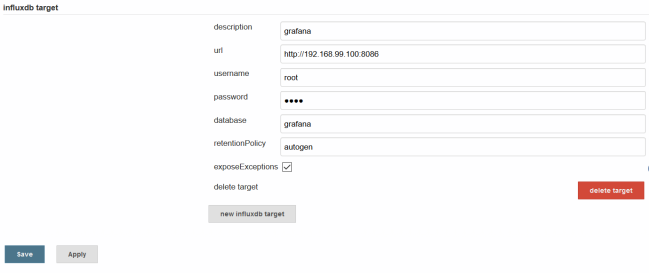
After installing URLTrigger plugin we have to enable it for all consumer pipelines. You can configure it to watch for changes in the returned JSON file from the Artifactory File List REST API, that is accessed via the following URI: http://192.168.99.100:8081/artifactory/api/storage/[PATH_TO_FOLDER_OR_REPO]/. The file maven-metadata.xml will change every time you deploy a new version of application to Artifactory. We can monitor the change of response’s content between the last two polls. The last field that has to be filled is Schedule. If you set it to * * * * * it will poll for a change every minute.

contracts-6

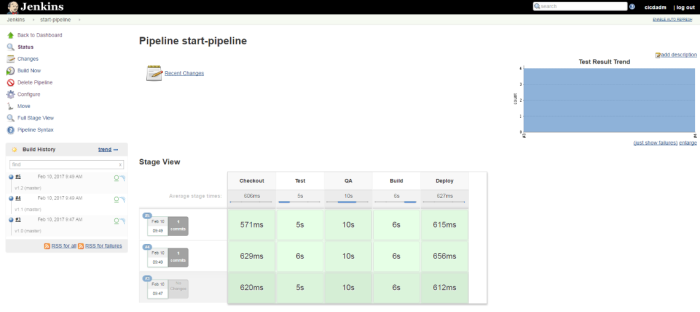
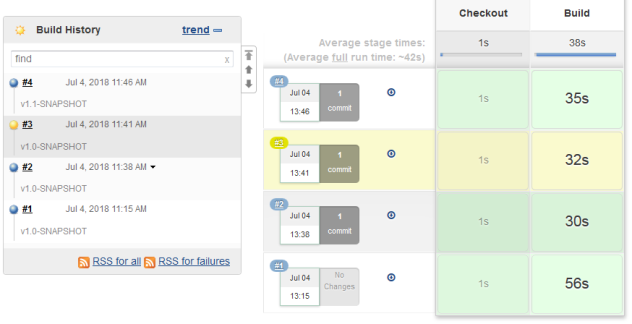
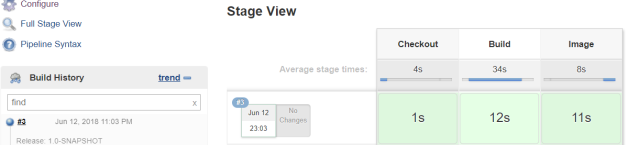
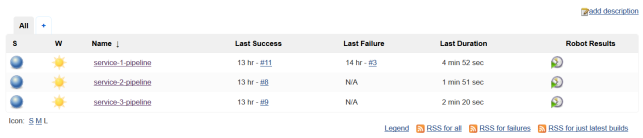
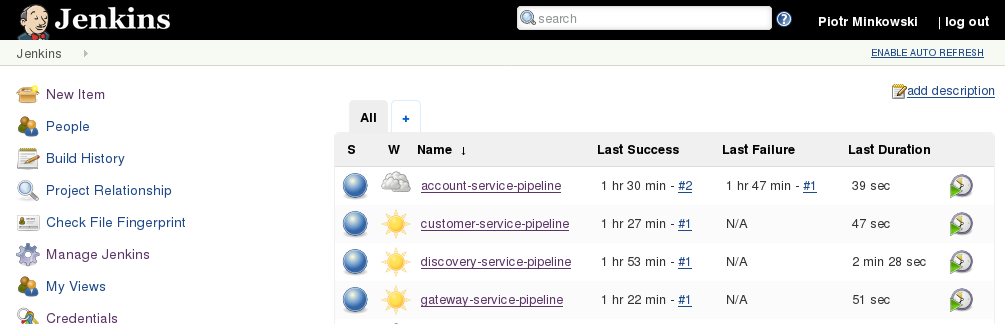
Our three pipelines for consumer applications are ready. The first run was finished with success.

contracts-7

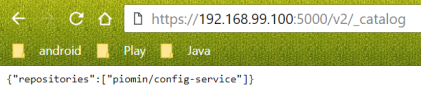
If you have already build person-service application and publish stubs to Artifactory you will see the following structure in libs-snapshot-local repository. I have deployed three different versions of API exposed by person-service. Each time I publish new version of contract all the dependent pipelines are triggered to verify it.

contracts-8

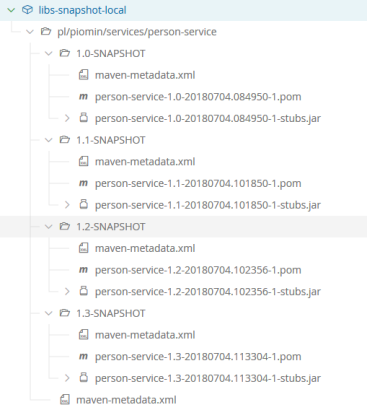
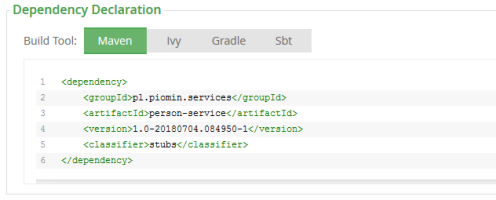
The JAR file with contracts is published under classifier stubs.

contracts-9

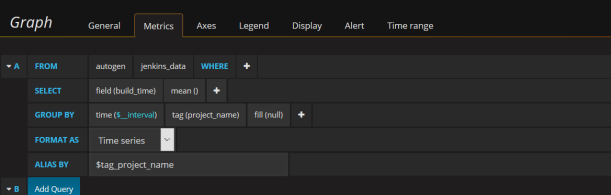
Spring Cloud Contract Stub Runner tries to find the latest version of contracts.

2018-07-04 11:46:53.273  INFO 4185 --- [           main] o.s.c.c.stubrunner.AetherStubDownloader  : Desired version is [+] - will try to resolve the latest version
2018-07-04 11:46:54.752  INFO 4185 --- [           main] o.s.c.c.stubrunner.AetherStubDownloader  : Resolved version is [1.3-SNAPSHOT]
2018-07-04 11:46:54.823  INFO 4185 --- [           main] o.s.c.c.stubrunner.AetherStubDownloader  : Resolved artifact [pl.piomin.services:person-service:jar:stubs:1.3-SNAPSHOT] to /var/jenkins_home/.m2/repository/pl/piomin/services/person-service/1.3-SNAPSHOT/person-service-1.3-SNAPSHOT-stubs.jar

6. Testing change in contract

Ok, we have already prepared contracts and configured our CI environment. Now, let’s perform change in the API exposed by person-service. We will just change the name of one field: accountNo to accountNumber.

contracts-12

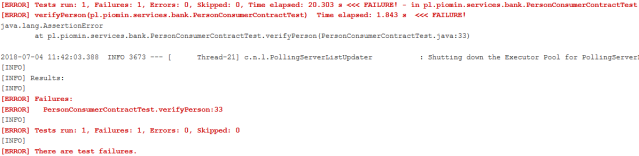
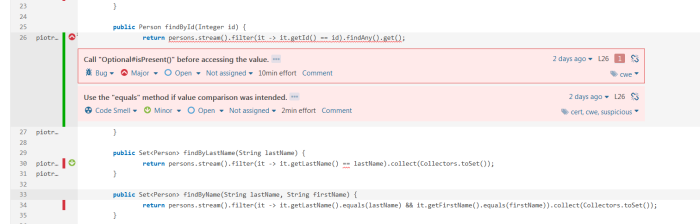
This changes requires a change in contract definition created on the producer side. If you modify the field name there person-service will build successfully and new version of contract will be published to Artifactory. Because all other pipelines listens for changes in the latest version of JAR files with stubs, the build will be started automatically. Microservices letter-service and contact-service do not use field accountNo, so their pipelines will not fail. Only bank-service pipeline report error in contract as shown on the picture below.

contracts-10

Now, if you were notified about failed verification of the newest contract version between person-service and bank-service, you can perform required change on the consumer side.

contracts-11

Local Continuous Delivery Environment with Docker and Jenkins

In this article I’m going to show you how to setup continuous delivery environment for building Docker images of our Java applications on the local machine. Our environment will consists of Gitlab (optional, otherwise you can use hosted GitHub), Jenkins master, Jenkins JNLP slave with Docker, and private Docker registry. All those tools will be run locally using their Docker images. Thanks to that you will be able to easily test it on your laptop, and then configure the same environment on production deployed on multiple servers or VMs. Let’s take a look on the architecture of the proposed solution.

art-docker-1

1. Running Jenkins Master

We use the latest Jenkins LTS image. Jenkins Web Dashboard is exposed on port 38080. Slave agents may connect master on default 50000 JNLP (Java Web Start) port.

$ docker run -d --name jenkins -p 38080:8080 -p 50000:50000 jenkins/jenkins:lts

After starting, you have to execute command docker logs jenkins in order to obtain an initial admin password. Find the following fragment in the logs, copy your generated password and paste in Jenkins start page available at http://192.168.99.100:38080.

art-docker-2

We have to install some Jenkins plugins to be able to checkout project from Git repository, build application from source code using Maven, and finally build and push Docker image to a private registry. Here’s a list of required plugins:

  • Git Plugin – this plugin allows to use Git as a build SCM
  • Maven Integration Plugin – this plugin provides advanced integration for Maven 2/3
  • Pipeline Plugin – this is a suite of plugins that allows you to create continuous delivery pipelines as a code, and run them in Jenkins
  • Docker Pipeline Plugin – this plugin allows you to build and use Docker containers from pipelines

2. Building Jenkins Slave

Pipelines are usually run on different machine than machine with master node. Moreover, we need to have Docker engine installed on that slave machine to be able to build Docker images. Although, there are some ready Docker images with Docker-in-Docker and Jenkins client agent, I have never find the image with JDK, Maven, Git and Docker installed. This is most commonly used tools when building images for your microservices, so it is definitely worth to have such an image with Jenkins image prepared.

Here’s the Dockerfile with Jenkins Docker-in-Docker slave with Git, Maven and OpenJDK installed. I used Docker-in-Docker as a base image (1). We can override some properties when running our container. You will probably have to override default Jenkins master address (2) and slave secret key (3). The rest of parameters is optional, but you can even decide to use external Docker daemon by overriding DOCKER_HOST environment variable. We also download and install Maven (4) and create user with special sudo rights for running Docker (5). Finally we run entrypoint.sh script, which starts Docker daemon and Jenkins agent (6).

FROM docker:18-dind # (1)
MAINTAINER Piotr Minkowski
ENV JENKINS_MASTER http://localhost:8080 # (2)
ENV JENKINS_SLAVE_NAME dind-node
ENV JENKINS_SLAVE_SECRET "" # (3)
ENV JENKINS_HOME /home/jenkins
ENV JENKINS_REMOTING_VERSION 3.17
ENV DOCKER_HOST tcp://0.0.0.0:2375
RUN apk --update add curl tar git bash openjdk8 sudo

ARG MAVEN_VERSION=3.5.2 # (4)
ARG USER_HOME_DIR="/root"
ARG SHA=707b1f6e390a65bde4af4cdaf2a24d45fc19a6ded00fff02e91626e3e42ceaff
ARG BASE_URL=https://apache.osuosl.org/maven/maven-3/${MAVEN_VERSION}/binaries

RUN mkdir -p /usr/share/maven /usr/share/maven/ref \
  && curl -fsSL -o /tmp/apache-maven.tar.gz ${BASE_URL}/apache-maven-${MAVEN_VERSION}-bin.tar.gz \
  && echo "${SHA}  /tmp/apache-maven.tar.gz" | sha256sum -c - \
  && tar -xzf /tmp/apache-maven.tar.gz -C /usr/share/maven --strip-components=1 \
  && rm -f /tmp/apache-maven.tar.gz \
  && ln -s /usr/share/maven/bin/mvn /usr/bin/mvn

ENV MAVEN_HOME /usr/share/maven
ENV MAVEN_CONFIG "$USER_HOME_DIR/.m2"
# (5)
RUN adduser -D -h $JENKINS_HOME -s /bin/sh jenkins jenkins && chmod a+rwx $JENKINS_HOME
RUN echo "jenkins ALL=(ALL) NOPASSWD: /usr/local/bin/dockerd" > /etc/sudoers.d/00jenkins && chmod 440 /etc/sudoers.d/00jenkins
RUN echo "jenkins ALL=(ALL) NOPASSWD: /usr/local/bin/docker" > /etc/sudoers.d/01jenkins && chmod 440 /etc/sudoers.d/01jenkins
RUN curl --create-dirs -sSLo /usr/share/jenkins/slave.jar http://repo.jenkins-ci.org/public/org/jenkins-ci/main/remoting/$JENKINS_REMOTING_VERSION/remoting-$JENKINS_REMOTING_VERSION.jar && chmod 755 /usr/share/jenkins && chmod 644 /usr/share/jenkins/slave.jar

COPY entrypoint.sh /usr/local/bin/entrypoint
VOLUME $JENKINS_HOME
WORKDIR $JENKINS_HOME
USER jenkins
ENTRYPOINT ["/usr/local/bin/entrypoint"] # (6)

Here’s the script entrypoint.sh.

#!/bin/sh
set -e
echo "starting dockerd..."
sudo dockerd --host=unix:///var/run/docker.sock --host=$DOCKER_HOST --storage-driver=vfs &
echo "starting jnlp slave..."
exec java -jar /usr/share/jenkins/slave.jar \
	-jnlpUrl $JENKINS_URL/computer/$JENKINS_SLAVE_NAME/slave-agent.jnlp \
	-secret $JENKINS_SLAVE_SECRET

The source code with image definition is available on GitHub. You can clone the repository https://github.com/piomin/jenkins-slave-dind-jnlp.git, build image and then start container using the following commands.

$ docker build -t piomin/jenkins-slave-dind-jnlp .
$ docker run --privileged -d --name slave -e JENKINS_SLAVE_SECRET=5664fe146104b89a1d2c78920fd9c5eebac3bd7344432e0668e366e2d3432d3e -e JENKINS_SLAVE_NAME=dind-node-1 -e JENKINS_URL=http://192.168.99.100:38080 piomin/jenkins-slave-dind-jnlp

Building it is just an optional step, because image is already available on my Docker Hub account.

art-docker-3

3. Enabling Docker-in-Docker Slave

To add new slave node you need to navigate to section Manage Jenkins -> Manage Nodes -> New Node. Then define permanent node with name parameter filled. The most suitable name is default name declared inside Docker image definition – dind-node. You also have to set remote root directory, which should be equal to path defined inside container for JENKINS_HOME environment variable. In my case it is /home/jenkins. The slave node should be launched via Java Web Start (JNLP).

art-docker-4

New node is visible on the list of nodes as disabled. You should click in order to obtain its secret key.

art-docker-5

Finally, you may run your slave container using the following command containing secret copied from node’s panel in Jenkins Web Dashboard.

$ docker run --privileged -d --name slave -e JENKINS_SLAVE_SECRET=fd14247b44bb9e03e11b7541e34a177bdcfd7b10783fa451d2169c90eb46693d -e JENKINS_URL=http://192.168.99.100:38080 piomin/jenkins-slave-dind-jnlp

If everything went according to plan you should see enabled node dind-node in the node’s list.

art-docker-6

4. Setting up Docker Private Registry

After deploying Jenkins master and slave, there is the last required element in architecture that has to be launched – private Docker registry. Because we will access it remotely (from Docker-in-Docker container) we have to configure secure TLS/SSL connection. To achieve it we should first generate TLS certificate and key. We can use openssl tool for it. We begin from generating a private key.

$ openssl genrsa -des3 -out registry.key 1024

Then, we should generate a certificate request file (CSR) by executing the following command.

$ openssl req -new -key registry.key -out registry.csr

Finally, we can generate a self-signed SSL certificate that is valid for 1 year using openssl command as shown below.

$ openssl x509 -req -days 365 -in registry.csr -signkey registry.key -out registry.crt

Don’t forget to remove passphrase from your private key.

$ openssl rsa -in registry.key -out registry-nopass.key -passin pass:123456

You should copy generated .key and .crt files to your docker machine. After that you may run Docker registry using the following command.

docker run -d -p 5000:5000 --restart=always --name registry -v /home/docker:/certs -e REGISTRY_HTTP_TLS_CERTIFICATE=/certs/registry.crt -e REGISTRY_HTTP_TLS_KEY=/certs/registry-nopass.key registry:2

If a registry has been successfully started you should able to access it over HTTPS by calling address https://192.168.99.100:5000/v2/_catalog from your web browser.

5. Creating application Dockerfile

The sample applications source code is available on GitHub in repository sample-spring-microservices-new (https://github.com/piomin/sample-spring-microservices-new.git). There are some modules with microservices. Each of them has Dockerfile created in the root directory. Here’s typical Dockerfile for our microservice built on top of Spring Boot.

FROM openjdk:8-jre-alpine
ENV APP_FILE employee-service-1.0-SNAPSHOT.jar
ENV APP_HOME /app
EXPOSE 8090
COPY target/$APP_FILE $APP_HOME/
WORKDIR $VERTICLE_HOME
ENTRYPOINT ["sh", "-c"]
CMD ["exec java -jar $APP_FILE"]

6. Building pipeline through Jenkinsfile

This step is the most important phase of our exercise. We will prepare pipeline definition, which combines together all the currently discussed tools and solutions. This pipeline definition is a part of every sample application source code. The change in Jenkinsfile is treated the same as a change in the source code responsible for implementing business logic.
Every pipeline is divided into stages. Every stage defines a subset of tasks performed through the entire pipeline. We can select the node, which is responsible for executing pipeline’s steps or leave it empty to allow random selection of the node. Because we have already prepared dedicated node with Docker, we force pipeline to being built by that node. In the first stage called Checkout we pull the source code from Git repository (1). Then we build an application binary using Maven command (2). Once the fat JAR file has been prepared we may proceed to building application’s Docker image (3). We use methods provided by Docker Pipeline Plugin. Finally, we push the Docker image with fat JAR file to secure private Docker registry (4). Such an image may be accessed by any machine that has Docker installed and has access to our Docker registry. Here’s the full code of Jenkinsfile prepared for module config-service.

node('dind-node') {
    stage('Checkout') { # (1)
      git url: 'https://github.com/piomin/sample-spring-microservices-new.git', credentialsId: 'piomin-github', branch: 'master'
    }
    stage('Build') { # (2)
      dir('config-service') {
        sh 'mvn clean install'
        def pom = readMavenPom file:'pom.xml'
        print pom.version
        env.version = pom.version
        currentBuild.description = "Release: ${env.version}"
      }
    }
    stage('Image') {
      dir ('config-service') {
        docker.withRegistry('https://192.168.99.100:5000') {
          def app = docker.build "piomin/config-service:${env.version}" # (3)
          app.push() # (4)
        }
      }
    }
}

7. Creating Pipeline in Jenkins Web Dashboard

After preparing application’s source code, Dockerfile and Jenkinsfile the only thing left is to create pipeline using Jenkins UI. We need to select New Item -> Pipeline and type the name of our first Jenkins pipeline. Then go to Configure panel and select Pipeline script from SCM in Pipeline section. Inside the following form we should fill an address of Git repository, user credentials and a location of Jenkinsfile.

art-docker-7

8. Configure GitLab WebHook (Optionally)

If you run GitLab locally using its Docker image you will be able to configure webhook, which triggers run of your pipeline after pushing changes to Git repository. To run GitLab using Docker execute the following command.

$ docker run -d --name gitlab -p 10443:443 -p 10080:80 -p 10022:22
gitlab/gitlab-ce:latest

Before configuring webhook in GitLab Dashboard we need to enable this feature for Jenkins pipeline. To achieve it we should first install GitLab Plugin.

art-docker-8

Then, you should come back to the pipeline’s configuration panel and enable GitLab build trigger. After that, webhook will be available for our sample pipeline called config-service-pipeline under URL http://192.168.99.100:38080/project/config-service-pipeline as shown in the following picture.

art-docker-9

Before proceeding to configuration of webhook in GitLab Dashboard you should retrieve your Jenkins user API token. To achieve it go to profile panel, select Configure and click button Show API Token.

art-docker-10

To add a new WebHook for your Git repository, you need to go to the section Settings -> Integrations and then fill the URL field with webhook address copied from Jenkins pipeline. Then paste Jenkins user API token into field Secret Token. Leave the Push events checkbox selected.

art-docker-11

9. Running pipeline

Now, we may finally run our pipeline. If you use GitLab Docker container as Git repository platform you just have to push changes in the source code. Otherwise you have to manually start build of pipeline. The first build will take a few minutes, because Maven has to download dependencies required for building an application. If everything will end with success you should see the following result on your pipeline dashboard.

art-docker-13

You can check out the list of images stored in your private Docker registry by calling the following HTTP API endpoint in your web browser: https://192.168.99.100:5000/v2/_catalog.

art-docker-12

Visualizing Jenkins Pipeline Results in Grafana

This time I describe a slightly lighter topic in comparison to the some previous posts. Personally, I think Grafana is a very cool tool for visualizing any timeline data. As it turns out it is quite easy to store and visualize Jenkins build results with InfluxDB plugin.

1. Starting docker containers

Let’s begin from starting needed docker containers with Grafana, InfluxDB and Jenkins.

docker run -d --name grafana -p 3000:3000 grafana/grafana
docker run -d --name influxdb -p 8086:8086 influxdb
docker run -d --name jenkins -p 38080:8080 -p 50000:50000 jenkins

Then you can run client container which links to InfluxDB container. Using this container you can create new database with command CREATE DATABASE grafana.

docker run --rm --link=influxdb -it influxdb influx -host influxdb

2. Configuring Jenkins

After starting Jenkins you need to download some plugins. For this sample it should be the following plugins:

If you are interested in more details about Jenkins configuration and Continuous Delivery take a look on my previous article about that topic How to setup Continuous Delivery environment.

In Manage Jenkins -> Configure System section add new InfluxDB target.

grafana-2

3. Building pipeline in Jenkins

With Jenkins Pipeline Plugin we are building pipelines using Groovy syntax. In the first step (1) we checkout project from GitHub, and then build it with Maven (2). Then we publish JUnit and JaCoCo reports (3) and finally send the whole report to InfluxDB (4).

node {
	def mvnHome
	try {
		stage('Checkout') { //(1)
			git 'https://github.com/piomin/sample-code-for-ci.git'
			mvnHome = tool 'maven3'
		}
		stage('Build') { //(2)
			dir('service-1') {
				sh "'${mvnHome}/bin/mvn' -Dmaven.test.failure.ignore clean package"
			}
		}
		stage('Tests') { //(3)
			junit '**/target/surefire-reports/TEST-*.xml'
			archive 'target/*.jar'
			step([$class: 'JacocoPublisher', execPattern: '**/target/jacoco.exec'])
		}
		stage('Report') { //(4)
			if (currentBuild.currentResult == 'UNSTABLE') {
				currentBuild.result = "UNSTABLE"
			} else {
				currentBuild.result = "SUCCESS"
			}
			step([$class: 'InfluxDbPublisher', customData: null, customDataMap: null, customPrefix: null, target: 'grafana'])
		}
	} catch (Exception e) {
		currentBuild.result = "FAILURE"
		step([$class: 'InfluxDbPublisher', customData: null, customDataMap: null, customPrefix: null, target: 'grafana'])
	}
}

I defined three pipelines for one per every module from the sample.

grafana-5

4. Building services

Add jacoco-maven-plugin Maven plugin to your pom.xml to enable code coverage reporting.

<plugin>
	<groupId>org.jacoco</groupId>
	<artifactId>jacoco-maven-plugin</artifactId>
	<version>0.7.9</version>
	<executions>
		<execution>
			<id>default-prepare-agent</id>
			<goals>
				<goal>prepare-agent</goal>
			</goals>
		</execution>
		<execution>
			<id>default-report</id>
			<phase>prepare-package</phase>
			<goals>
				<goal>report</goal>
			</goals>
		</execution>
	</executions>
</plugin>

Sample application source code is available on GitHub. It consists of three simple modules, which does not do anything important, but only has JUnit tests needed for build results visualization.

5. Configuring Grafana

First, configure Grafana data source as your InfluxDB Docker container instance.

grafana-1

With InfluxDB Plugin we can report metrics generated by JUnit, Cobertura, JaCoCo, Robot Framework and Performance Plugin. In the sample application I’ll show you the reports from JUnit and JaCoCo. Let’s configure our graphs in Grafana. As you can see on the picture below I defined the graph with pipeline Build Time data. The result are grouped by project name.

grafana-4

Here are two graphs. The first illustrating every pipeline build time data in milliseconds, and second percentage test code coverage. For test coverage we need to select from jacoco_data table instead of jenkins_data and then choose field jacoco_method_coverage_rate.

grafana-3

For more details about visualizing metrics with Grafana and InfluxDB you can refer to my previous article Custom metrics visualization with Grafana and InfluxDB.

Code Quality with SonarQube

Source code quality analysis is an essential part of the Continuous Integration process. Together with automated tests it is the key element to deliver reliable software without many bugs, security vulnerabilities or performance leaks. Probably the best static code analyzer you can find on the market is SonarQube. It has a support for more than 20 programming languages. It can be easily integrated with the most popular Continuous Integration engines like Jenkins or TeamCity. Finally, it has many features and plugins which can be easily managed from extensive web dashboard.

However, before we proceed to discuss about the most powerful capabilities of this solution it is well worth to ask Why we do it? Would it be productive for us to force developers to focus on code quality? Probably most of us are programmers and we exactly know that everyone else expect from us to deliver code which meet business demands rather than looks nice 🙂 After all do we really want to break the build by not fulfilling not important rule like maximum line length – rather a little pleasure. On the other hand taking over source code from someone else who was not paying attention to any of good programming practice is also not welcome if you know what I mean. But be calm, SonarQube is the right solution for you. In this article I’ll to show you that carrying about high code quality can be a good fun and above all you can learn more how to develop better code, while other team members spend time on fixing their bugs 🙂

Enough talk go to action. I suggest you to run your test instance of SonarQube using Docker. Here’s SonarQube run command. Then you can login to web dashboard available under http://192.168.99.100:9000 with admin/admin credentials.

docker run -d --name sonarqube -p 9000:9000 -p 9092:9092 sonarqube

You are signed in to the web dashboard but there are no projects created yet. To perform source code scanning you should just run one command mvn sonar:sonar if you are using maven in the building process. Don’t forget to add SonarQube server address in settings.xml file as you on the fragment below.

<profile>
	<id>sonar</id>
	<activation>
		<activeByDefault>true</activeByDefault>
	</activation>
	<properties>
		<sonar.host.url>http://192.168.99.100:9000</sonar.host.url>
	</properties>
</profile>

When SonarQube analyse finishes you will see new project with the same name as maven artifact name with your code metrics and statistics. I created sample Spring Boot application where I tried to perform some most popular mistakes which impact on code quality. Source code is available on GitHub. The right module for analyse is named person-service. However, the code with many bugs and vulnerabilities is pushed to v0.1 branch. Master branch has a latest version with the corrections performed basing on SonarQube analyse what I’m going to describe on the next section of that article. Ok, let’s start analyse with mvn command. We can be surprised a little – the code analyse result for 0.1 version is rather not satisfying. Although I spend much time on making important mistakes SonarQube reported only some bugs and code smells were detected and quality gate status is ‘Passed’.

sonar-1

Let’s take a closer look on quality gates in SonarQube. Like I mentioned before we would not like to break the build by not fulfiling one or group of not very important rules. We can achieve it by creating quality gate. This is a set of requirements that tells us whether or not going to deployment with new version od project. There is default quality gate for Java but we can change its thresholds or create the new one. The default quality gate has thresholds set only for new code, so I decided to create the one for my sample application minimum test coverage set on 50 percent, unit test success detection and ratings basic on full code. Now, scanning result looks a little different 🙂

sonar-3sonar-2

To enable scanning test coverage in SonarQube we should add jacoco plugin to maven pom.xml. During maven build mvn clean test -Dmaven.test.failure.ignore=true sonar:sonar the report would be automatically generated and uploaded to SonarQube.

<plugin>
	<groupId>org.jacoco</groupId>
	<artifactId>jacoco-maven-plugin</artifactId>
	<version>0.7.9</version>
	<executions>
		<execution>
			<id>default-prepare-agent</id>
			<goals>
				<goal>prepare-agent</goal>
			</goals>
		</execution>
		<execution>
			<id>default-report</id>
			<phase>prepare-package</phase>
			<goals>
				<goal>report</goal>
			</goals>
		</execution>
	</executions>
</plugin>

The last change that has to be done before application rescan is to installing some plugins and enabling rules disabled by default. The list of all active and inactive rules can be displayed in Quality Profiles section. In the default profile for Java the are more than 400 rules available and 271 active on start. I suggest you install FindBugs and Checkstyle plugins. Those plugins has many additional rules for Java which can be activated for our profile. Now there are about 1.1k inactive rules in many categories. Which of them should be activated depends on you, you can activate them in the default profile, create your new profile or use one of predefined profile, which were automatically created by plugins we installed before.  In my opinion the best way to select right rules is to create simple project and check which rules are suitable for you. Then you can check out the detailed description and disable the rule if needed. After activating some rules provided by Checkstyle plugin I have a report with 5 bugs and 77 code smells. The most important errors are visible in the pictures below.

sonar-5sonar-6sonar-7

All issues reported by SonarQube can be easily reviewed using UI dashboard for each project in the Issue tab. We can also install plugin SonarLint which integrates with most popular IDEs like Eclipse or IntelliJ and all those issue will be displayed there. Now, we can proceed to fix errors. All changes which I performed to resolve issues can be display on GitHub repository from branches v0.1 to v0.6. I resolved all problems except some checked exception warnings which I set to Resolved (Won’t fix). Those issues won’t be reported after next scans.

sonar-7

Finally my project looks as you could see in the picture below. All ratings have a score ‘A’, test coverage is greater that 60% and quality gate is ‘Passed’. Final person-service version is commited into master branch.

sonar-8

Like you see there are many rules which can be applied to your project during SonarQube scanning, but sometimes it would be not enough for your organization needs. In that case you may search for some additional plugins or create your own plugin with the rules that meet your specific requirements. In my sample available on GitHub there is module sonar-rules where I defined the rule checking whether all public classes have javadoc comments including @author field. To create SonarQube plugin add the following fragment to your pom.xml and change packaging type to sonar-plugin.

<plugin>
	<groupId>org.sonarsource.sonar-packaging-maven-plugin</groupId>
	<artifactId>sonar-packaging-maven-plugin</artifactId>
	<version>1.17</version>
	<extensions>true</extensions>
	<configuration>
		<pluginKey>piotjavacustom</pluginKey>
		<pluginName>PiotrCustomRules</pluginName>
		<pluginDescription>For test purposes</pluginDescription>
		<pluginClass>pl.piomin.sonar.plugin.CustomRulesPlugin</pluginClass>
		<sonarLintSupported>true</sonarLintSupported>
		<sonarQubeMinVersion>6.0</sonarQubeMinVersion>
	</configuration>
</plugin>

Here’s the class with custom rule definition. First we have to get a scanned class node (Kind.CLASS), a then process first comment (Kind.TRIVIA) in the class file. The rule parameters like name or priority are set inside @Role annotation.

@Rule(key = "CustomAuthorCommentCheck",
		name = "Javadoc comment should have @author name",
		description = "Javadoc comment should have @author name",
		priority = Priority.MAJOR,
		tags = {"style"})
public class CustomAuthorCommentCheck extends IssuableSubscriptionVisitor {

	private static final String MSG_NO_COMMENT = "There is no comment under class";
	private static final String MSG_NO_AUTHOR = "There is no author inside comment";

	private Tree actualTree = null;

	@Override
	public List<Kind> nodesToVisit() {
		return ImmutableList.of(Kind.TRIVIA, Kind.CLASS);
	}

	@Override
	public void visitTrivia(SyntaxTrivia syntaxTrivia) {
		String comment = syntaxTrivia.comment();
		if (syntaxTrivia.column() != 0)
			return;
		if (comment == null) {
			reportIssue(actualTree, MSG_NO_COMMENT);
			return;
		}
		if (!comment.contains("@author")) {
			reportIssue(actualTree, MSG_NO_AUTHOR);
			return;
		}
	}

	@Override
	public void visitNode(Tree tree) {
		if (tree.is(Kind.CLASS)) {
			actualTree = tree;
		}
	}

}

Before building and deploying plugin into SonarQube server it can be easily tested using junit. Inside the src/test/file directory we should place test data – java files which are scanned during junit test. For failure test we should also create file CustomAuthorCommentCheck_java.json in the /org/sonar/l10n/java/rules/squid/ directory with rule definition.

@Test
public void testOk() {
	JavaCheckVerifier.verifyNoIssue("src/test/files/CustomAuthorCommentCheck.java", new CustomAuthorCommentCheck());
}

@Test
public void testFail() {
	JavaCheckVerifier.verify("src/test/files/CustomAuthorCommentCheckFail.java", new CustomAuthorCommentCheck());
}

Finally, build maven project and copy generated JAR artifact from target directory to SonarQube docker container into $SONAR_HOME/extensions/plugins directory. Then restart your docker container.

docker cp target/sonar-plugins-1.0-SNAPSHOT sonarqube:/opt/sonarqube/extensions/plugins

After SonarQube restart your plugin’s rules are visible under Rules section.

sonar-4

The last thing to do is to run SonarQube scanning in the Continuous Integration process. SonarQube can be easily integrated with the most popular CI server – Jenkins. Here’s the fragment of Jenkins pipeline where we perform source code scanning and then waiting for quality gate result. If you interested in more details about Jenkins pipelines, Continuous Integration and Delivery read my previous post How to setup Continuous Delivery environment.

stage('SonarQube analysis') {
	withSonarQubeEnv('My SonarQube Server') {
		sh 'mvn clean package sonar:sonar'
	}
}
stage("Quality Gate") {
	timeout(time: 1, unit: 'HOURS') {
		def qg = waitForQualityGate()
		if (qg.status != 'OK') {
			error "Pipeline aborted due to quality gate failure: ${qg.status}"
		}
	}
}

Microservices Continuous Delivery with Docker and Jenkins

Docker, Microservices, Continuous Delivery are currently some of the most popular topics in the world of programming. In an environment consisting of dozens of microservices communicating with each other it seems to be particularly important the automation of the testing, building and deployment process. Docker is excellent solution for microservices, because it can create and run isolated containers with service. Today, I’m going to present you how to create basic continuous delivery pipeline for sample microservices using most popular software automation tool – Jenkins.

Sample Microservices

Before I get into the main topic of the article I say a few words about structure and tools used for sample microservices creation. Sample application consists of two sample microservices communicating with each other (account, customer), discovery server (Eureka) and API gateway (Zuul). It was implemented using Spring Boot and Spring Cloud frameworks. Its source code is available on GitHub. Spring Cloud has support for microservices discovery and gateway out of the box – we only have to define right dependencies inside maven project configuration file (pom.xml). The picture illustrating the adopted solution architecture is visible below. Both customer, account REST API services, discovery server and gateway running inside separated docker containers. Gateway is the entry point to the microservices system. It is interacting with all other services. It proxies requests to the selected microservices searching its addresses in discovery service. In case of existing more than one instance of each account or customer microservice the request is load balanced with  Ribbon  and  Feignclient. Account and customer services are registering themselves into the discovery server after startup. There is also a possibility of interaction between them, for example if we would like to find and return all customer’s account details.

Image title

I wouldn’t like to go into the details of those microservices implementation with Spring Boot and Spring Cloud frameworks. If you are interested in detailed description of the sample application development you can read it in my blog post here. Generally, Spring framework has a full support for microservices with all Netflix OSS tools like Ribbon, Hystrix and Eureka. In the blog post I described how to implement service discovery, distributed tracing, load balancing, logging trace ID propagation, API gateway for microservices with those solutions.

Dockerfiles

Each service in the sample source code has  Dockerfilewith docker image build definition. It’s really simple. Here’s Dockerfile for account service. We use openjdk as a base image. Jar file from target is added to the image and then run using java -jar command. Service is running on port 2222 which is exposed outside.

FROM openjdk
MAINTAINER Piotr Minkowski <piotr.minkowski@gmail.com>
ADD target/account-service.jar account-service.jar
ENTRYPOINT ["java", "-jar", "/account-service.jar"]
EXPOSE 2222

We also had to set main class in the JAR manifest. We achieve it using spring-boot-maven-plugin in module pom.xml. The fragment is visible below. We also set build finalName to cut off version number from target JAR file. Dockerfile and maven build definition is pretty similar for all other microservices.

<build>
  <finalName>account-service</finalName>
  <plugins>
    <plugin>
      <groupId>org.springframework.boot</groupId>
      <artifactId>spring-boot-maven-plugin</artifactId>
      <version>1.5.2.RELEASE</version>
      <configuration>
        <mainClass>pl.piomin.microservices.account.Application</mainClass>
        <addResources>true</addResources>
      </configuration>
      <executions>
        <execution>
          <goals>
            <goal>repackage</goal>
          </goals>
        </execution>
      </executions>
    </plugin>
  </plugins>
</build>

Jenkins pipelines

We use Pipeline Plugin for building continous delivery for our microservices. In addition to the standard plugins set on Jenkins we also need Docker Pipeline Plugin by CloudBees. There are four pipelines defined as you can see in the picture below.

Image title

Here’s pipeline definition written in Groovy language for discovery service. We have 5 stages of execution. Inside Checkout stage we are pulling changes for remote Git repository of the project. Then project is build with mvn clean install command and also maven version is read from  pom.xml. In Image stage we build docker image from discovery service Dockerfile and then push that image to local registry. In the fourth step we are running built image with default port exposed and hostname visible for linked docker containers. Finally, account pipeline is started with no wait option, which means that source pipeline is finished and won’t wait for account pipeline execution finish.

node {

    withMaven(maven:'maven') {

        stage('Checkout') {
            git url: 'https://github.com/piomin/sample-spring-microservices.git', credentialsId: 'github-piomin', branch: 'master'
        }

        stage('Build') {
            sh 'mvn clean install'

            def pom = readMavenPom file:'pom.xml'
            print pom.version
            env.version = pom.version
        }

        stage('Image') {
            dir ('discovery-service') {
                def app = docker.build "localhost:5000/discovery-service:${env.version}"
                app.push()
            }
        }

        stage ('Run') {
            docker.image("localhost:5000/discovery-service:${env.version}").run('-p 8761:8761 -h discovery --name discovery')
        }

        stage ('Final') {
            build job: 'account-service-pipeline', wait: false
        }      

    }

}

Account pipeline is very similar. The main difference is inside fourth stage where account service container is linked to discovery container. We need to linked that containers, because account-service is registering itself in discovery server and must be able to connect it using hostname.

node {

    withMaven(maven:'maven') {

        stage('Checkout') {
            git url: 'https://github.com/piomin/sample-spring-microservices.git', credentialsId: 'github-piomin', branch: 'master'
        }

        stage('Build') {
            sh 'mvn clean install'

            def pom = readMavenPom file:'pom.xml'
            print pom.version
            env.version = pom.version
        }

        stage('Image') {
            dir ('account-service') {
                def app = docker.build "localhost:5000/account-service:${env.version}"
                app.push()
            }
        }

        stage ('Run') {
            docker.image("localhost:5000/account-service:${env.version}").run('-p 2222:2222 -h account --name account --link discovery')
        }

        stage ('Final') {
            build job: 'customer-service-pipeline', wait: false
        }      

    }

}

Similar pipelines are also defined for customer and gateway service. They are available in main project catalog on each microservice as  Jenkinsfile. Every image which is built during pipeline execution is also pushed to local Docker registry. To enable local registry on our host we need to pull and run Docker registry image and also use that registry address as an image name prefix while pulling or pushing. Local registry is exposed on its default 5000 port. You can see the list of pushed images to local registry by calling its REST API, for example http://localhost:5000/v2/_catalog.

docker run -d --name registry -p 5000:5000 registry

Testing

You should launch the build on discovery-service-pipeline. This pipeline will not only run build for discovery service but also call start next pipeline build (account-service-pipeline) at the end.The same rule is configured for account-service-pipeline which calls customer-service-pipeline and for customer-service-pipeline which call gateway-service-pipeline. So, after all pipelines finish you can check the list of running docker containers by calling  docker ps  command. You should have seen 5 containers: local registry and our four microservices. You can also check the logs of each container by running command  docker logs, for example  docker logs account. If everything works fine you should be able te call some service like http://localhost:2222/accounts or via Zuul gateway http://localhost:8765/account/account.

</div>
<div class="cm-replace _replace_51">CONTAINER ID        IMAGE                                           COMMAND                  CREATED             STATUS              PORTS                    NAMES
fa3b9e408bb4        localhost:5000/gateway-service:1.0-SNAPSHOT     "java -jar /gatewa..."   About an hour ago   Up About an hour    0.0.0.0:8765->8765/tcp   gateway
cc9e2b44fe44        localhost:5000/customer-service:1.0-SNAPSHOT    "java -jar /custom..."   About an hour ago   Up About an hour    0.0.0.0:3333->3333/tcp   customer
49657f4531de        localhost:5000/account-service:1.0-SNAPSHOT     "java -jar /accoun..."   About an hour ago   Up About an hour    0.0.0.0:2222->2222/tcp   account
fe07b8dfe96c        localhost:5000/discovery-service:1.0-SNAPSHOT   "java -jar /discov..."   About an hour ago   Up About an hour    0.0.0.0:8761->8761/tcp   discovery
f9a7691ddbba        registry</div>
<div class="cm-replace _replace_51">

Conclusion

I have presented the basic sample of Continuous Delivery environment for microservices using Docker and Jenkins. You can easily find out the limitations of presented solution, for example we has to linked docker containers with each other to enable communication between them or all of the tools and microservices are running on the same machine. For more advanced sample we could use Jenkins slaves running on different machines or docker containers (more here), tools like Kubernetes for orchestration and clustering, maybe Docker-in-Docker containers for simulating multiple docker machines. I hope that article is a fine introduction to the microservices Continuous Delivery and helps you to understand the basics of this idea. I think that you could expect more my advanced articles about that subject near the future.

Jenkins nodes on Docker containers

Jenkins is most popular an open source automation server written in Java. It has many interesting plugins and features. Today, I’m going to show you one of them – how to set up Jenkins master server with one slave instance connected to master. So that we will be able to run distributed builds using few docker containers. For that sample we use docker images of Jenkins (jenkins) and Jenkins slave (jenkinsci/jnlp-slave). Let’s start from running Jenkins docker container.

docker run -d --name jenkins -p 50000:50000 -p 50080:8080 jenkins

Go to management console (http://192.168.99.100:50080) and select Manage Jenkins -> Manage Nodes and then click New Node. In the next page you have to put the slave name – for that sample is slave-1. After clicking OK you will see new node on the list. Now, you can configure it by clicking setting button and display node details by clicking node name on the list.

jenkins-slave

New node is created by is still disabled. After clicking node you will see the page with details. The important information is in command secret line property. Copy that token.

jenkins-slave1

Now, we are going to run docker image with JNLP agent. In the docker run command we paste Jenkins master URL, secret token and chosen node name (slave-1). If you would like to set up it without docker container you should download slave agent JAR file by clicking Launch button and run agent from command line like in the picture above.

docker run -d --name jenkins-slave1 jenkinsci/jnlp-slave -url http://192.168.99.100:50080 5d681c12e9c68f14373d62375e852d0874ea9daeca3483df4c858ad3556d406d slave-1

After running slave container you should see name slave-1 in the Build Executor Status below master node.

jenkins-slave2

Now, we could configure sample Jenkins pipeline to test our new slave. Pipeline builds could be ran on master node or on slave node. Here sample pipeline fragment. For trying that sample you need to have Pipeline Plugin installed on your Jenkins server.

node() {
    stage('Checkout') {
        ...
    }

    stage('Build') {
        ...
    }
}

You can select the node for running your pipeline by providing node name. Now, build always run on slave-1 node.

node('slave-1') {
    stage('Checkout') {
        ...
    }

    stage('Build') {
        ...
    }
}

How to setup Continuous Delivery environment

I have already read some interesting articles and books about Continuous Delivery, because I had to setup it inside my organization. The last document about this subject I can recommend is DZone Guide to DevOps. If you interested in this area of software development it can be really enlightening reading for you. The main purpose of my article is to show rather practical site of Continuous Delivery – tools which can be used to build such environment. I’m going to show how to build professional Continuous Delivery environment using:

  • Jenkins – most popular open source automation server
  • GitLab – web-based Git repository manager
  • Artifactory – open source Maven repository manager
  • Ansible – simple open source automation engine
  • SonarQube – open source platform for continuous code quality

Here’s picture showing our continuous delivery environment.

continuous_delivery

The changes pushed to Git repository managed by GitLab server are automatically propagated to Jenkins using webhook. We enable push and merge request triggers. SSL verification will be disabled. In the URL field we have to put jenkins pipeline address with authentication credentials (user and password) and secret token. This API token which is visible in jenkins user profile under Configure tab.

webhook
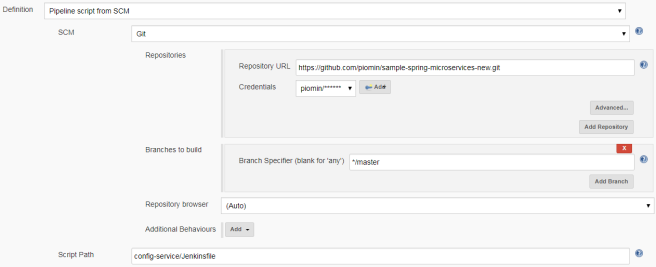
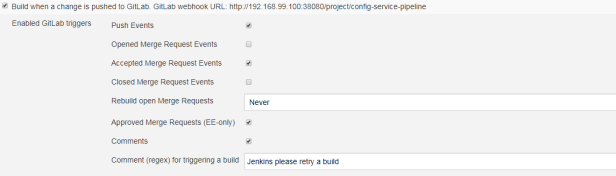
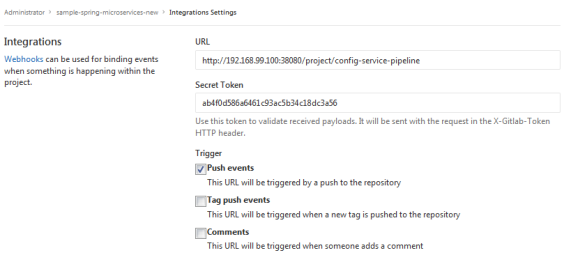
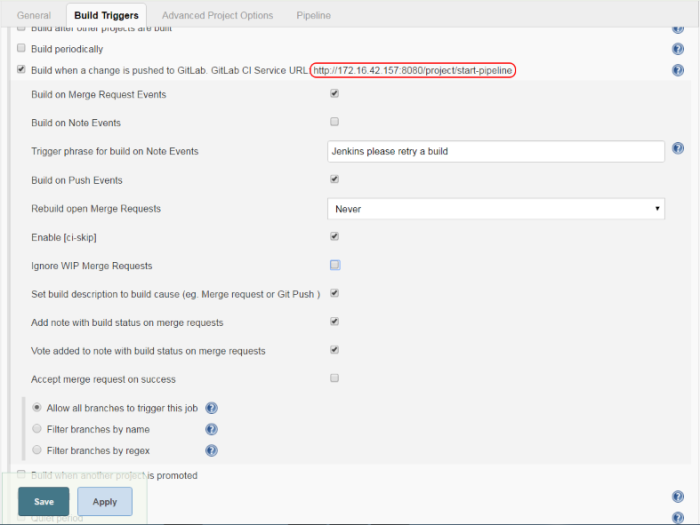
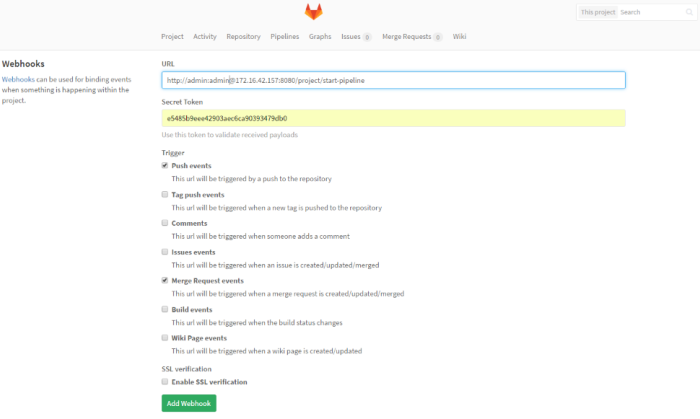
Here’s jenkins pipeline configuration in ‘Build triggers’ section. We have to enable option ‘Build when a change is pushed to GitLab‘. GitLab CI Service URL is the address we have already set in GitLab webhook configuration. There are push and merge request enabled from all branches. It can also be added additional restriction for branch filtering: by name or by regex. To support such kind of trigger in jenkins you need have Gitlab plugin installed.

jenkins

There are two options of events which trigger jenkins build:

  • push – change in source code is pushed to git repository
  • merge request –  change in source code is pushed to one branch and then committer creates merge request to the build branch from GitLab management console

In case you would like to use first option you have to disable build branch protection to enable direct push to that branch. In case of using merge request branch protection need to be activated.

protection

Merge request from GitLab console is very intuitive. Under section ‘Merge request’ we are selecting source and target branch and confirm action.

merge

Ok, many words about GitLab and Jenkins integration… Now you know how to configure it. You only have to decide if you prefer push or merge request in your continuous delivery configuration. Merge request is used for code review in Gitlab – so it is useful additional step in your continuous pipeline. Let’s move on. We have to install some other plugins in jenkins to integrate it with Artifactory, SonarQube and Ansible. Here’s the full list of jenkins plugins I used for continuous delivery process inside my organization:

Here’s configuration on my jenkins pipeline for sample maven project.

node {

    withEnv(["PATH+MAVEN=${tool 'Maven3'}bin"]) {

        stage('Checkout') {
            def branch = env.gitlabBranch
            env.branch = branch
            git url: 'http://172.16.42.157/minkowp/start.git', credentialsId: '5693747c-2f45-4557-ada2-a1da9bbfe0af', branch: branch
        }

        stage('Test') {
            def pom = readMavenPom file: 'pom.xml'
            print "Build: " + pom.version
            env.POM_VERSION = pom.version
            sh 'mvn clean test -Dmaven.test.failure.ignore=true'
            junit '**/target/surefire-reports/TEST-*.xml'
            currentBuild.description = "v${pom.version} (${env.branch})"
        }

        stage('QA') {
            withSonarQubeEnv('sonar') {
                sh 'mvn org.sonarsource.scanner.maven:sonar-maven-plugin:3.2:sonar'
            }
        }

        stage('Build') {
            def server = Artifactory.server "server1"
            def buildInfo = Artifactory.newBuildInfo()
            def rtMaven = Artifactory.newMavenBuild()
            rtMaven.tool = 'Maven3'
            rtMaven.deployer releaseRepo:'libs-release-local', snapshotRepo:'libs-snapshot-local', server: server
            rtMaven.resolver releaseRepo:'remote-repos', snapshotRepo:'remote-repos', server: server
            rtMaven.run pom: 'pom.xml', goals: 'clean install -Dmaven.test.skip=true', buildInfo: buildInfo
            publishBuildInfo server: server, buildInfo: buildInfo
        }

        stage('Deploy') {
            dir('ansible') {
                ansiblePlaybook playbook: 'preprod.yml'
            }
            mail from: 'ci@example.com', to: 'piotr.minkowski@play.pl', subject: "Nowa wersja start: '${env.POM_VERSION}'", body: "Wdrożono nowa wersję start '${env.POM_VERSION}' na środowisku preprodukcyjnym."
        }

    }
}

There are five stages in my pipeline:

  1. Checkout – source code checkout from git branch. Branch name is sent as parameter by GitLab webhook
  2. Test – running JUnit test and creating test report visible in jenkins and changing job description
  3. QA – running source code scanning using SonarQube scanner
  4. Build – build package resolving artifacts from Artifactory and publishing new application release to Artifactory
  5. Deploy – deploying application package and configuration on server using ansible

Following Ansible website it is a simple automation language that can perfectly describe an IT application infrastructure. It’s easy-to-learn, self-documenting, and doesn’t require a grad-level computer science degree to read. Ansible using SSH keys to authenticate on the remote host. So you have to put your SSH key to authorized_keys file in the remote host before running ansible commands on it. The main idea of that that is to create playbook with set of ansible commands. Playbooks are Ansible’s configuration, deployment, and orchestration language. They can describe a policy you want your remote systems to enforce, or a set of steps in a general IT process. Here is catalog structure with ansible configuration for application deploy.

start_ansible


Here’s my ansible playbook code. It defines remote host, user to connect and role name. This file is used inside jenkins pipeline on ansiblePlaybook step.

---
- hosts: pBPreprod
  remote_user: default

  roles:
    - preprod

Here’s main.yml file where we define set of ansible commands to on remote server.

---
- block:
  - name: Copy configuration file
    template: src=config.yml.j2 dest=/opt/start/config.yml

  - name: Copy jar file
    copy: src=../target/start.jar dest=/opt/start/start.jar

  - name: Run jar file
    shell: java -jar /opt/start/start.jar

You can check out build results on jenkins console. There is also fine pipeline visualization with stage execution time. Each build history record has link to Artifactory build information and SonarQube scanner report.

jenkins