This time I describe a slightly lighter topic in comparison to the some previous posts. Personally, I think Grafana is a very cool tool for visualizing any timeline data. As it turns out it is quite easy to store and visualize Jenkins build results with InfluxDB plugin.
1. Starting docker containers
Let’s begin from starting needed docker containers with Grafana, InfluxDB and Jenkins.
docker run -d --name grafana -p 3000:3000 grafana/grafana
docker run -d --name influxdb -p 8086:8086 influxdb
docker run -d --name jenkins -p 38080:8080 -p 50000:50000 jenkins
Then you can run client container which links to InfluxDB container. Using this container you can create new database with command CREATE DATABASE grafana.
docker run --rm --link=influxdb -it influxdb influx -host influxdb
2. Configuring Jenkins
After starting Jenkins you need to download some plugins. For this sample it should be the following plugins:
If you are interested in more details about Jenkins configuration and Continuous Delivery take a look on my previous article about that topic How to setup Continuous Delivery environment.
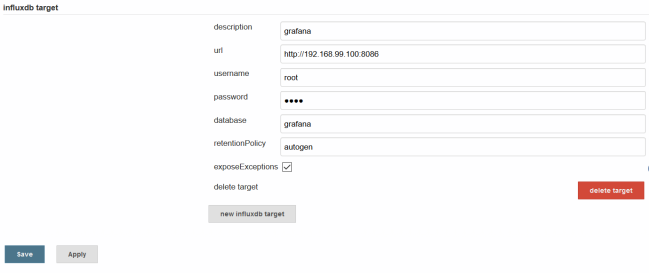
In Manage Jenkins -> Configure System section add new InfluxDB target.
3. Building pipeline in Jenkins
With Jenkins Pipeline Plugin we are building pipelines using Groovy syntax. In the first step (1) we checkout project from GitHub, and then build it with Maven (2). Then we publish JUnit and JaCoCo reports (3) and finally send the whole report to InfluxDB (4).
node {
	def mvnHome
	try {
		stage('Checkout') { //(1)
			git 'https://github.com/piomin/sample-code-for-ci.git'
			mvnHome = tool 'maven3'
		}
		stage('Build') { //(2)
			dir('service-1') {
				sh "'${mvnHome}/bin/mvn' -Dmaven.test.failure.ignore clean package"
			}
		}
		stage('Tests') { //(3)
			junit '**/target/surefire-reports/TEST-*.xml'
			archive 'target/*.jar'
			step([$class: 'JacocoPublisher', execPattern: '**/target/jacoco.exec'])
		}
		stage('Report') { //(4)
			if (currentBuild.currentResult == 'UNSTABLE') {
				currentBuild.result = "UNSTABLE"
			} else {
				currentBuild.result = "SUCCESS"
			}
			step([$class: 'InfluxDbPublisher', customData: null, customDataMap: null, customPrefix: null, target: 'grafana'])
		}
	} catch (Exception e) {
		currentBuild.result = "FAILURE"
		step([$class: 'InfluxDbPublisher', customData: null, customDataMap: null, customPrefix: null, target: 'grafana'])
	}
}
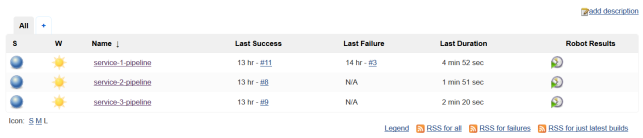
I defined three pipelines for one per every module from the sample.
4. Building services
Add jacoco-maven-plugin Maven plugin to your pom.xml to enable code coverage reporting.
<plugin>
	<groupId>org.jacoco</groupId>
	<artifactId>jacoco-maven-plugin</artifactId>
	<version>0.7.9</version>
	<executions>
		<execution>
			<id>default-prepare-agent</id>
			<goals>
				<goal>prepare-agent</goal>
			</goals>
		</execution>
		<execution>
			<id>default-report</id>
			<phase>prepare-package</phase>
			<goals>
				<goal>report</goal>
			</goals>
		</execution>
	</executions>
</plugin>
Sample application source code is available on GitHub. It consists of three simple modules, which does not do anything important, but only has JUnit tests needed for build results visualization.
5. Configuring Grafana
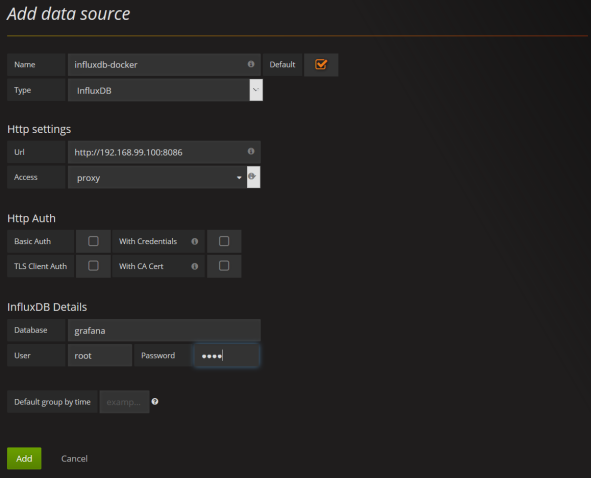
First, configure Grafana data source as your InfluxDB Docker container instance.
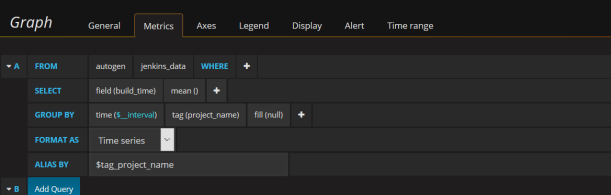
With InfluxDB Plugin we can report metrics generated by JUnit, Cobertura, JaCoCo, Robot Framework and Performance Plugin. In the sample application I’ll show you the reports from JUnit and JaCoCo. Let’s configure our graphs in Grafana. As you can see on the picture below I defined the graph with pipeline Build Time data. The result are grouped by project name.
Here are two graphs. The first illustrating every pipeline build time data in milliseconds, and second percentage test code coverage. For test coverage we need to select from jacoco_data table instead of jenkins_data and then choose field jacoco_method_coverage_rate.

For more details about visualizing metrics with Grafana and InfluxDB you can refer to my previous article Custom metrics visualization with Grafana and InfluxDB.

jacoco_data table is not getting created. Maven project builds fine but it does not get the table created in Inlfux DB. Please let me know if anything missing to make this work. Nice article. Will be very useful if everything works end to end as outlined here.
[InfluxDB Plugin] Publishing data to: [url=http://172.17.0.3:8086, description=jacocotarget, username=jenkins, password=*****, database=grafana]
[InfluxDB Plugin] Completed.
LikeLike
Well, I don’t think I have missed something. And generally it should work fine. However, this address in your logs is strange. 172.17.0.3?
LikeLike
Thanks for this article!
I’ve faced such issue on “Tests” step when I run through Jenkins:
> Archive JUnit-formatted test results — **/target/surefire-reports/*.xml — (self time 369ms)
> Recording test results
> Test reports were found but none of them are new. Did leafNodes run?
> For example, /Users/Shared/Jenkins/Home/workspace/pipe/target/surefire-reports/*.xml is 15 min old
Any idea what am I doing wrong?
Here’s my project: https://github.com/KonstantinxVx/jmeter-mvn
Thanks in advance for your reply!
LikeLike
the problem occurs because you did not implement any junit tests
LikeLike
Ok, thanks.
Also, as I understand in Influx you store “pipeline build time data” and “percentage test code coverage”, but is it possible to get the data related to my JMeter load test (response time, number of threads and so on)?
LikeLike
These metrics are strictly related to jenkins pipelines. First of them is time of build, while second is the junit code coverage for built project. Probably you may run jmeter test as junit test, so i think it is possible
LikeLike